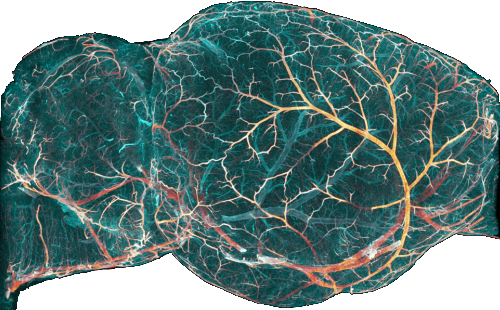
"""
DataViewer
==========
Data viewer showing 3d data as 2d slices.
Usage
-----
.. image:: ../static/DataViewer.jpg
Note
----
This viewer is based on the pyqtgraph package.
"""
from __future__ import annotations
__author__ = 'Christoph Kirst <christoph.kirst.ck@gmail.com>, Charly Rousseau <charly.rousseau@icm-institute.org>'
__license__ = 'GPLv3 - GNU General Public License v3 (see LICENSE)'
__copyright__ = 'Copyright © 2020 by Christoph Kirst'
__webpage__ = 'https://idisco.info'
__download__ = 'https://github.com/ClearAnatomics/ClearMap'
import time
import functools as ft
from datetime import datetime
import numpy as np
import pyqtgraph as pg
from PyQt5 import QtWidgets
from PyQt5.QtCore import QEvent, QRect, QSize, pyqtSignal, Qt
from PyQt5.QtGui import QPainter, QIcon
from PyQt5.QtWidgets import (QWidget, QRadioButton, QLabel, QSplitter, QApplication, QSizePolicy, QPushButton,
QCheckBox, QGraphicsPathItem, QGridLayout, QLineEdit, QScrollArea, QFileDialog, QSpinBox)
from ClearMap.Utils.utilities import runs_on_spyder
from ClearMap.IO import IO as cmp_io
from ClearMap.IO.Source import Source
from ClearMap.Visualization.Qt.data_viewer_luts import LUT, HighLowLUT
pg.CONFIG_OPTIONS['useOpenGL'] = False # set to False if trouble seeing data.
if not pg.QAPP:
pg.mkQApp()
[docs]
class DataViewer(QWidget):
#: Triggered when the mouse is clicked in the image view. The signal emits the x, y, and z coordinates of the click.
mouse_clicked = pyqtSignal(int, int, int)
DEFAULT_SCATTER_PARAMS = {
'pen': 'red',
'brush': 'red',
'symbol': '+',
'size': 10
}
def __init__(self, source,
points=None, vectors=None, orientations=None, annotation=None,
axis=None, scale=None, title=None,
invertY=False, minMax=None, screen=None, parent=None, default_lut='flame', max_projection=None,
points_style=None, vectors_style=None, original_orientation='zcxy', orientations_style=None, **kwargs):
# super().__init__(self, parent, **kwargs)
QWidget.__init__(self, parent, **kwargs) # TODO: check why super() doesn't handle **kwargs properly
# Images sources
self.sources = []
self.original_orientation = original_orientation
self.n_sources = 0
self.scroll_axis = None
self.source_shape = None
self.source_scale = None # xyz scaling factors between display and real coordinates
self.source_index = None # The xyz center of the current view
self.source_range_x = None
self.source_range_y = None
self.source_slice = None # current slice (in scroll axis)
self.cross = None # cursor
self.pals = [] # linked DataViewers
self.scatter = None
self.scatter_coords = None
self.atlas = None # WARNING: overlap w/ self.anotation ??
self.structure_names = None
self.z_cursor_width = 5
self.points = points
if self.points is not None:
self.points = cmp_io.read(points)
self.points_item = None
self.points_style = dict(pen=None, brush='white')
if points_style is not None:
self.points_style.update(points_style)
self.vectors = vectors
if self.vectors is not None:
self.vectors = cmp_io.read(vectors)
self.vectors_item = None
self.vectors_base_item = None
self.vectors_style = dict(pen=None, brush='lightblue')
if vectors_style is not None:
self.vectors_style.update(vectors_style)
self.orientations = orientations
if self.orientations is not None:
self.orientations = cmp_io.read(orientations)
self.orientations_item = None
self.orientations_style = dict(pen='gray')
if orientations_style is not None:
self.orientations_style.update(orientations_style)
self.vectors = vectors
self.vectors_item = None
self.annotation = annotation
self.initializeSources(source, axis=axis, scale=scale)
# ## Gui Construction
original_title = title
if title is None:
if isinstance(source, str):
title = source
elif isinstance(source, Source):
title = source.location
if title is None:
title = 'DataViewer'
self.setWindowTitle(title)
self.resize(1600, 1200)
self.layout = QtWidgets.QGridLayout(self)
self.layout.setContentsMargins(0, 0, 0, 0)
# image pane
self.view = pg.ViewBox()
self.view.setAspectLocked(True)
self.view.invertY(invertY)
self.view.sigRangeChanged.connect(self.onRangeChanged)
self.graphicsView = pg.GraphicsView()
self.graphicsView.setObjectName("GraphicsView")
self.graphicsView.setCentralItem(self.view)
splitter = QSplitter()
splitter.setOrientation(Qt.Horizontal)
splitter.setSizes([self.width() - 10, 10])
self.layout.addWidget(splitter)
image_splitter = QSplitter()
image_splitter.setOrientation(Qt.Vertical)
image_splitter.setSizePolicy(QSizePolicy.Expanding, QSizePolicy.Expanding)
splitter.addWidget(image_splitter)
# Image plots
image_options = dict(clipToView=True, autoDownsample=True, autoLevels=False, useOpenGL=None)
if self.all_colour:
self.image_items = []
for s in self.sources:
slc = self.source_slice[:s.ndim]
layer = self.color_last(s.array[slc])
self.image_items.append(pg.ImageItem(layer, **image_options))
else:
self.image_items = [pg.ImageItem(s[self.source_slice[:s.ndim]], **image_options) for s in self.sources]
for itm in self.image_items:
itm.setRect(QRect(0, 0, int(self.source_range_x), int(self.source_range_y)))
itm.setCompositionMode(QPainter.CompositionMode_Plus)
self.view.addItem(itm)
self.view.setXRange(0, self.source_range_x)
self.view.setYRange(0, self.source_range_y)
# slice selector
if original_title:
self.slicePlot = pg.PlotWidget(title=f"""
<html><head/><body>
<h1 style=" margin-top:18px; margin-bottom:12px; margin-left:0px; margin-right:0px;
-qt-block-indent:0; text-indent:0px;">
<span style=" font-size:xx-large; font-weight:700;">{original_title}</span></h1></body></html>
""")
else:
self.slicePlot = pg.PlotWidget()
size_policy = QSizePolicy(QSizePolicy.Preferred, QSizePolicy.Preferred) # TODO: add option for sizepolicy
size_policy.setHorizontalStretch(0)
size_policy.setVerticalStretch(0)
size_policy.setHeightForWidth(self.slicePlot.sizePolicy().hasHeightForWidth())
self.slicePlot.setSizePolicy(size_policy)
self.slicePlot.setMinimumSize(QSize(0, 40 + 40*bool(original_title)))
self.slicePlot.setObjectName("roiPlot")
self.sliceLine = pg.InfiniteLine(0, movable=True)
self.sliceLine.setPen((255, 255, 255, 200), width=self.z_cursor_width)
self.sliceLine.setZValue(1)
self.slicePlot.addItem(self.sliceLine)
self.slicePlot.hideAxis('left')
self.slicePlot.installEventFilter(self)
self.updateSlicer()
self.sliceLine.sigPositionChanged.connect(self.updateSlice)
# Axis tools # FIXME: extract and make addWidget widget location incremental not absolute
self.axis_buttons = []
axis_tools_layout, axis_tools_widget = self.__setup_axes_controls()
# max projection depth
self.max_projection = max_projection
self.max_projection_edit = QLineEdit()
self.max_projection_edit.setPlaceholderText('max projection')
if self.max_projection is not None:
self.max_projection_edit.setText('%d' % self.max_projection)
# self.max_projection_edit.setValidator(pg.QtGui.QIntValidator())
self.max_projection_edit.setMaxLength(4)
self.max_projection_edit.setAlignment(Qt.AlignRight)
self.max_projection_edit.setMaximumWidth(60)
self.max_projection_edit.editingFinished.connect(self.change_max_projection)
axis_tools_layout.addWidget(self.max_projection_edit, 0, 3)
# points color
self.points_color_button = pg.ColorButton(color=self.points_style.get('brush'))
self.points_color_button.setVisible(False)
self.points_color_button.setMaximumWidth(30)
self.points_color_button.sigColorChanged.connect(self.change_points_color)
axis_tools_layout.addWidget(self.points_color_button, 0, 4)
# vectors color and threshold
self.vectors_color_button = pg.ColorButton(color=self.vectors_style.get('brush'))
self.vectors_color_button.setVisible(False)
self.vectors_color_button.setMaximumWidth(30)
self.vectors_color_button.sigColorChanged.connect(self.change_vectors_color)
axis_tools_layout.addWidget(self.vectors_color_button, 0, 5)
self.vectors_threshold_edit = QLineEdit()
vectors_threshold = self.vectors_style.get('threshold', None)
if vectors_threshold is not None:
self.vectors_threshold_edit.setText('%.4f' % vectors_threshold)
self.vectors_threshold_edit.setVisible(False)
self.vectors_threshold_edit.setMaxLength(6)
self.vectors_threshold_edit.setAlignment(Qt.AlignRight)
self.vectors_threshold_edit.setMaximumWidth(60)
self.vectors_threshold_edit.editingFinished.connect(self.change_vectors_threshold)
axis_tools_layout.addWidget(self.vectors_threshold_edit, 0, 6)
# orientation threshold
self.orientations_color_button = pg.ColorButton(color=self.orientations_style.get('pen'))
self.orientations_color_button.setVisible(False)
self.orientations_color_button.setMaximumWidth(30)
self.orientations_color_button.sigColorChanged.connect(self.change_orientations_color)
axis_tools_layout.addWidget(self.orientations_color_button, 0, 7)
self.orientations_threshold_edit = QLineEdit()
self.orientations_threshold_edit.setVisible(False)
orientations_threshold = self.orientations_style.get('threshold', None)
if orientations_threshold is not None:
self.orientations_threshold_edit.setText('%.4f' % orientations_threshold)
self.orientations_threshold_edit.setMaxLength(6)
self.orientations_threshold_edit.setAlignment(Qt.AlignRight)
self.orientations_threshold_edit.setMaximumWidth(60)
self.orientations_threshold_edit.editingFinished.connect(self.change_orientations_threshold)
axis_tools_layout.addWidget(self.orientations_threshold_edit, 0, 8)
# coordinate label
self.source_pointer = np.zeros(self.sources[0].ndim, dtype=int)
self.source_label = QLabel("")
self.source_label_scroll = QScrollArea()
self.source_label_scroll.setMaximumHeight(30)
self.source_label_scroll.setWidgetResizable(True)
self.source_label_scroll.horizontalScrollBar().setStyleSheet("QScrollBar {height:0px;}")
self.source_label_scroll.setWidget(self.source_label)
axis_tools_layout.addWidget(self.source_label_scroll, 0, 9)
self.screenshot_btn = QPushButton('📸')
icon = QIcon.fromTheme('camera-photo')
if not icon.isNull():
self.screenshot_btn.setIcon(icon)
self.screenshot_btn.setIconSize(QSize(20, 20))
self.screenshot_btn.setToolTip('Save screenshot')
self.screenshot_btn.setMaximumWidth(34)
self.screenshot_btn.clicked.connect(self.save_screenshot)
axis_tools_layout.addWidget(self.screenshot_btn, 1, 2)
# Controls for marker size
# FIXME: Invisible if no markers
self.marker_size_spin = QSpinBox()
self.marker_size_spin.setRange(1, 100)
self.marker_size_spin.setValue(10)
self.marker_size_spin.setPrefix("Marker: ")
self.marker_size_spin.valueChanged.connect(lambda: self.updateSlice(force_update=True))
axis_tools_layout.addWidget(self.marker_size_spin, 1, 3)
self.marker_scale_with_zoom = QCheckBox("Scale w/ zoom")
self.marker_scale_with_zoom.setChecked(False)
self.marker_scale_with_zoom.stateChanged.connect(lambda: self.updateSlice(force_update=True))
axis_tools_layout.addWidget(self.marker_scale_with_zoom, 1, 4)
self.marker_size_spin.setVisible(self.scatter is not None)
self.marker_scale_with_zoom.setVisible(self.scatter is not None)
self.graphicsView.scene().sigMouseMoved.connect(self.updateLabelFromMouseMove)
# compose the image viewer
image_splitter.addWidget(self.graphicsView)
image_splitter.addWidget(self.slicePlot)
image_splitter.addWidget(axis_tools_widget)
image_splitter.setSizes([self.height() - 35 - 20, 35, 20])
# lut widgets
self.luts = [LUT(image=i, color=c) for i, c in zip(self.image_items, self.__get_colors(default_lut))]
lut_layout = QtWidgets.QGridLayout()
self.lut_layout = lut_layout
lut_layout.setContentsMargins(0, 0, 0, 0)
for d, lut in enumerate(self.luts):
lut_layout.addWidget(lut, 0, d)
lut_widget = QWidget()
lut_widget.setLayout(lut_layout)
lut_widget.setContentsMargins(0, 0, 0, 0)
lut_widget.setSizePolicy(QSizePolicy.Preferred, QSizePolicy.Expanding) # TODO: add option for sizepolicy
splitter.addWidget(lut_widget)
splitter.setStretchFactor(0, 1)
splitter.setStretchFactor(1, 0)
# update scale
for lut in self.luts:
lut.range_buttons[1][2].click()
if minMax is not None:
self.setMinMax(minMax)
self.initialize_points_item()
self.initialize_vectors_item()
self.change_max_projection()
# self.change_orientations_threshold()
self.show()
def _add_hi_lo_lut(self, low_threshold_spin_box, high_threshold_spin_box):
for sb in (low_threshold_spin_box, high_threshold_spin_box):
sb.setKeyboardTracking(False)
dtype_min, dtype_max = np.iinfo(self.sources[0].dtype).min, np.iinfo(self.sources[0].dtype).max
self.threshold_lut = HighLowLUT(view_box=self.view,
base_item=self.image_items[0],
hist_item=self.luts[0].lut, # unwrap wrapper
low=low_threshold_spin_box.value(),
high=high_threshold_spin_box.value(),
dtype_min=dtype_min,
dtype_max=dtype_max)
low_threshold_spin_box.editingFinished.connect(lambda: self.threshold_lut.set_low(low_threshold_spin_box.value()))
high_threshold_spin_box.editingFinished.connect(lambda: self.threshold_lut.set_high(high_threshold_spin_box.value()))
# self.luts[0].setParent(None) # Schedule for deletion
# self.luts[0] = self.threshold_lut # replace
# self.lut_layout.addWidget(self.threshold_lut, 0, 0) # FIXME: check if we keep it here
@property
def space_axes(self):
color_axis = self.color_axis
if color_axis is None:
color_axis = -1 # Cannot use None with == testing because of implicit cast
return [ax for ax in range(self.sources[0].ndim) if ax != color_axis]
[docs]
def eventFilter(self, source, event):
if event.type() == QEvent.Wheel:
angle = event.angleDelta().y()
# steps = angle / abs(angle)
steps = angle / 120
self.sliceLine.setValue(self.sliceLine.value() + steps)
return super().eventFilter(source, event)
def __cast_source(self, source):
if isinstance(source, tuple):
source = list(source)
if not isinstance(source, list):
source = [source]
return source
[docs]
def initializeSources(self, source, scale=None, axis=None, update=True):
# initialize sources and axis settings
source = self.__cast_source(source)
self.n_sources = len(source)
self.sources = [cmp_io.open_ro(s) for s in source]
for s in self.sources:
if s.ndim == 2:
s.shape = s.shape + (1,) # Add empty z dimension # FIXME: see if works or need to expand_dims
# self.__cast_bools()
# self.__ensure_3d()
# source shapes
self.source_shape = self.padded_shape(self.sources[0].shape)
for s in self.sources:
if s.ndim > 4:
raise RuntimeError(f'Source has {s.ndim} > 4 dimensions: {s}!')
if s.shape[:2] != self.source_shape[:2]:
raise RuntimeError(f'Sources shape {self.source_shape} vs {s.shape} in source {s}!')
# slicing
shape = list(range(self.sources[0].ndim))
if 3 in self.sources[0].shape: # Color image
shape.pop(self.sources[0].shape.index(3))
self.scroll_axis = axis if axis is not None else shape[-1] # Default to last axis
self.source_index = (np.array(self.source_shape, dtype=float) / 2).astype(int)
# scaling
scale = np.array(scale) if scale is not None else np.array([]) # Test Not default np.ones(3) ??
self.source_scale = np.pad(scale, (0, self.sources[0].ndim - len(scale)), 'constant', constant_values=1)
self.updateSourceRange()
self.updateSourceSlice()
[docs]
def setSource(self, source, index='all'): # TODO: see if could factor with __init__
if index == 'all':
source = self.__cast_source(source)
if self.n_sources != len(source):
raise RuntimeError(f'Number of sources does not match! got {len(source)}, expected {self.n_sources}')
source = [cmp_io.open_ro(s) for s in source]
index = range(self.n_sources)
else:
s = self.sources
s[index] = cmp_io.open_ro(source)
source = s
index = [index]
# self.__cast_bools()
for i in index:
s = source[i]
if s.shape != self.source_shape:
raise RuntimeError('Shape of sources does not match!')
elif s.ndim < 2 or s.ndim > 4: # FIXME: handle RGB
raise RuntimeError(f'Sources dont have dimensions 2, 3 or 4 but {s.ndim} in source {i}!')
if s.ndim == 4:
layer = self.color_last(s.array[self.source_slice[:s.ndim]])
self.image_items[i].updateImage(layer)
else:
if s.ndim == 2:
s.shape = s.shape + (1,)
self.image_items[i].updateImage(s[self.source_slice[:s.ndim]])
self.sources = source
def __setup_axes_controls(self):
axis_tools_layout = QGridLayout()
for d, ax in enumerate('xyz'):
button = QRadioButton(ax)
button.setMaximumWidth(50)
axis_tools_layout.addWidget(button, 0, d)
button.clicked.connect(ft.partial(self.setSliceAxis, d))
self.axis_buttons.append(button)
self.axis_buttons[self.space_axes.index(self.scroll_axis)].setChecked(True)
axis_tools_widget = QWidget()
axis_tools_widget.setLayout(axis_tools_layout)
for i in range(self.n_sources):
box = QCheckBox(f'{i}')
box.setMaximumWidth(50)
box.setChecked(True)
box.stateChanged.connect(ft.partial(self.toggle_layer, i))
axis_tools_layout.addWidget(box, 1, i)
self.axis_buttons.append(box)
return axis_tools_layout, axis_tools_widget
[docs]
def toggle_layer(self, i, state):
self.image_items[i].setVisible(state == Qt.Checked)
def __get_colors(self, default_lut):
if self.n_sources == 1:
cols = [default_lut]
elif self.n_sources == 2:
cols = ['purple', 'green']
else:
cols = np.array(['white', 'green', 'red', 'blue', 'purple'] * self.n_sources)[:self.n_sources]
return cols
[docs]
def color_last(self, source):
shape = np.array(source.shape)
c_idx = np.where(shape == 3)[0]
indices = np.delete(np.arange(source.ndim), c_idx[0])
indices = np.hstack((indices, c_idx))
return source.transpose(indices)
[docs]
def is_color(self, source):
return source.ndim > 3 and 3 in source.shape
@property
def color_axis(self):
try:
return self.sources[0].shape.index(3)
except ValueError:
return None
@property
def all_colour(self):
return all([self.is_color(s) for s in self.sources])
[docs]
def getXYAxes(self): # FIXME: properties
return [ax for ax in range(self.sources[0].ndim) if ax not in (self.scroll_axis, self.color_axis)]
[docs]
def updateSourceRange(self):
x, y = self.getXYAxes()
self.source_range_x = round(self.source_scale[x] * self.source_shape[x]) # TODO: check if round
self.source_range_y = round(self.source_scale[y] * self.source_shape[y])
[docs]
def updateSourceSlice(self):
"""Set the current slice of the source"""
if self.all_colour:
self.source_slice = [slice(None)] * 4 # TODO: check if could use self.sources[0].ndim
else:
self.source_slice = [slice(None)] * 3
if self.scroll_axis:
self.source_slice[self.scroll_axis] = self.source_index[self.scroll_axis]
self.source_slice = tuple(self.source_slice)
[docs]
def updateSlicer(self):
ax = self.scroll_axis
self.slicePlot.setXRange(0, self.source_shape[ax])
self.sliceLine.setValue(self.source_index[ax])
stop = self.source_shape[ax] + 0.5
self.sliceLine.setBounds([0, stop])
[docs]
def updateLabelFromMouseMove(self, event_pos):
x, y = self.get_coords(event_pos)
self.sync_cursors(x, y)
self._updateCoords(x, y)
def _updateCoords(self, x, y):
x_axis, y_axis = self.getXYAxes()
pos = [None] * self.sources[0].ndim
scaled_x, scaled_y = self.scale_coords(x, x_axis, y, y_axis)
z = self.source_index[self.scroll_axis]
pos[x_axis] = scaled_x
pos[y_axis] = scaled_y
pos[self.scroll_axis] = z
self.source_pointer = np.array(pos)
self.updateLabel()
[docs]
def scale_coords(self, x, x_axis, y, y_axis):
scaled_x = min(int(x / self.source_scale[x_axis]), self.source_shape[x_axis] - 1)
scaled_y = min(int(y / self.source_scale[y_axis]), self.source_shape[y_axis] - 1)
return scaled_x, scaled_y
[docs]
def get_coords(self, pos):
mouse_point = self.view.mapSceneToView(pos)
x, y = mouse_point.x(), mouse_point.y()
x = min(max(0, x), self.source_range_x)
y = min(max(0, y), self.source_range_y)
return x, y
[docs]
def sync_cursors(self, x, y):
if self.cross is not None:
self.cross.set_coords([x, y])
self.view.update()
for pal in self.pals:
pal.cross.set_coords([x, y])
pal._updateCoords(x, y)
pal.view.update()
[docs]
def updateLabel(self):
x_axis, y_axis = self.getXYAxes()
x, y, z = self.source_pointer[[x_axis, y_axis, self.scroll_axis]]
xs, ys, zs = self.source_scale[[x_axis, y_axis, self.scroll_axis]]
slc = [Ellipsis] * max(3, self.sources[0].ndim)
slc[x_axis] = x
slc[y_axis] = y
slc[self.scroll_axis] = z
slc = tuple(slc)
if self.all_colour:
vals = ", ".join([str(s.array[slc]) for s in self.sources])
else: # FIXME: check why array does not work for ndim = 3 (i.e. why we need 2 versions)
vals = ", ".join([str(s[slc]) for s in self.sources])
label = f"({x}, {y}, {z}) {{{x*xs:.2f}, {y*ys:.2f}, {z*zs:.2f}}} [{vals}]"
if self.annotation is not None:
struct_info = self.annotation.get(self.sources[0][x, y, z], None)
if struct_info:
label += f"[{struct_info}]"
elif self.atlas is not None:
try:
id_ = np.asscalar(self.atlas[slc]) # Deprecated since np version 1.16
except AttributeError:
id_ = self.atlas[slc].item()
label = f" <b style='color:#2d9cfc;'>{self.structure_names[id_]} ({id_})</b>" + label
if self.parent() is None or not self.parent().objectName().lower().startswith('dataviewer'):
label = f"<span style='font-size: 12pt; color: black'>{label}</span>"
self.source_label.setText(label)
[docs]
def updateSlice(self, force_update=False):
ax = self.scroll_axis
index = min(max(0, int(self.sliceLine.value())), self.source_shape[ax]-1)
if self.max_projection is not None:
slc_ax = (
slice(max(0, index - self.max_projection), min(self.source_shape[ax], index + self.max_projection)),);
else:
slc_ax = (index,)
if index != self.source_index[ax] or force_update:
self.source_index[ax] = index
self.source_slice = self.source_slice[:ax] + slc_ax + self.source_slice[ax+1:]
self.source_pointer[ax] = index
self.updateLabel()
self.updateImage()
self.update_points()
self.update_vectors()
self.update_orientations()
if self.scatter is not None:
self.plot_scatter_markers(ax, index)
[docs]
def refresh(self):
"""
Forces the plot to refresh, notably to display scatter info on top
Returns
-------
"""
self.sliceLine.setValue(self.sliceLine.value() + 1)
self.sliceLine.setValue(self.sliceLine.value() - 1)
# if self.scatter is not None:
# ax = self.scroll_axis
# index = min(max(0, int(self.sliceLine.value())), self.source_shape[ax] - 1)
# self.plot_scatter_markers(ax, index)
[docs]
def setSliceAxis(self, axis):
# old_scroll_axis = self.scroll_axis
self.scroll_axis = self.space_axes[axis]
self.updateSourceRange()
self.updateSourceSlice()
for img_itm, src in zip(self.image_items, self.sources):
slc = self.source_slice
if self.all_colour:
layer = src.array[slc]
img_itm.updateImage(self.color_last(layer))
else:
img_itm.updateImage(src[slc])
img_itm.setRect(QRect(0, 0, self.source_range_x, self.source_range_y))
self.view.setXRange(0, self.source_range_x)
self.view.setYRange(0, self.source_range_y)
self.updateSlicer()
self.refresh()
[docs]
def updateImage(self):
for img_item, src in zip(self.image_items, self.sources):
slc = self.source_slice[:src.ndim]
if self.max_projection is not None:
image = np.max(src[self.source_slice[:src.ndim]], axis=self.source_axis)
elif self.all_colour:
image = src.array[slc]
image = self.color_last(image)
else:
image = src[slc]
if image.dtype == bool:
image = image.view('uint8')
img_item.updateImage(image)
[docs]
def setMinMax(self, min_max, source=None):
if source is None:
if not isinstance(min_max, list):
min_max = [min_max] * len(self.sources)
source = list(range(len(self.sources)))
else:
if not isinstance(source, list):
source = [source]
if not isinstance(min_max, list):
min_max = [min_max] * len(source)
for s, mM in enumerate(min_max):
self.luts[s].lut.region.setRegion(mM)
[docs]
def onRangeChanged(self):
if self.scatter is not None:
ax = self.scroll_axis
index = min(max(0, int(self.sliceLine.value())), self.source_shape[ax] - 1)
self.plot_scatter_markers(ax, index)
def _scale_markers(self):
base_size = self.marker_size_spin.value()
if self.marker_scale_with_zoom.isChecked():
x_range, y_range = self.view.viewRange()
scale_x = self.source_range_x / (x_range[1] - x_range[0])
scale_y = self.source_range_y / (y_range[1] - y_range[0])
zoom_factor = (scale_x + scale_y) / 2.0
scaled_size = round(base_size * zoom_factor)
else:
scaled_size = base_size
zoom_factor = 1.0 # for the surrounding-slice path
return scaled_size, zoom_factor
[docs]
def plot_scatter_markers(self, ax, index):
if self.scatter_coords is None:
return
self.marker_size_spin.setVisible(self.scatter is not None)
self.marker_scale_with_zoom.setVisible(self.scatter is not None)
self.scatter.clear()
self.scatter_coords.axis = ax
scaled_size, zoom_factor = self._scale_markers()
pos = self.scatter_coords.get_pos(index)
if all(pos.shape):
if self.scatter_coords.has_colours:
self.scatter.setData(pos=pos,
symbol=(self.scatter_coords.get_symbols(index)),
size=scaled_size,
**self.scatter_coords.get_draw_params(index))
else:
self.scatter.setData(pos=pos, **DataViewer.DEFAULT_SCATTER_PARAMS.copy()) # TODO: check if copy required
try: # TODO: check why some markers trigger errors
if self.scatter_coords.z_radius is not None and self.scatter_coords.z_radius > 0:
marker_params = self.scatter_coords.get_3d_markers(
index, base_size=self.marker_size_spin.value())
if marker_params['pos'].shape[0]: # We have markers in view
marker_params['size'] = np.round(marker_params['size'] * zoom_factor).astype(int)
self.scatter.addPoints(brush=pg.mkBrush((0, 0, 0, 0)), **marker_params)
except KeyError as err:
print(f'DataViewer error: {err}')
[docs]
def change_max_projection(self, value=None):
if value is not None:
self.max_projection_edit.setText('%d' % value)
text = self.max_projection_edit.text()
try:
text = int(text)
if text <= 0:
text = None
except ValueError:
text = None
self.max_projection = text
self.updateSlice(force_update=True)
[docs]
def initialize_points_item(self):
if self.points_item is not None:
self.view.removeItem(self.points_item)
self.points_item = pg.ScatterPlotItem(**self.points_style)
self.view.addItem(self.points_item)
[docs]
def set_points(self, points):
self.points = points
if self.points is not None:
self.points = cmp_io.open_ro(points) # TODO: see if read is better
self.initialize_points_item()
self.update_points()
self.points_color_button.setVisible(True)
[docs]
def update_points(self):
if self.points is not None:
points = self.points
axis = self.source_axis
axes = [d for d in range(3) if d != axis]
index = self.source_index[axis]
# select points in slice
valid_min, valid_max = index - 0.5, index + 0.5
if self.max_projection is not None:
valid_min, valid_max = valid_min - self.max_projection, valid_max + self.max_projection
valid = np.logical_and(valid_min < points[..., axis], points[..., axis] <= valid_max)
points = points[valid]
x, y = [points[:, a] + 0.5 for a in axes]
self.points_item.setData(x=x, y=y)
[docs]
def change_points_color(self):
color = self.points_color_button.color()
self.points_style['brush'] = color
self.points_item.setBrush(self.points_style['brush'])
[docs]
def initialize_vectors_item(self):
if self.vectors_base_item is not None:
self.view.removeItem(self.vectors_base_item)
self.vectors_base_item = pg.ScatterPlotItem(**self.vectors_style)
self.view.addItem(self.vectors_base_item)
[docs]
def set_vectors(self, vectors):
self.vectors = vectors
self.update_vectors()
self.vectors_color_button.setVisible(True)
self.vectors_threshold_edit.setVisible(True)
[docs]
def update_vectors(self):
if self.vectors is not None:
vectors = self.vectors
axis = self.source_axis
index = self.source_index[axis]
slicing = tuple(slice(None) if a != axis else index for a in range(3))
axes = [d for d in range(3) if d != axis]
vx, vy = [vectors[slicing + (a,)] for a in axes]
x, y = np.meshgrid(np.arange(vectors.shape[axes[0]], dtype=float),
np.arange(vectors.shape[axes[1]], dtype=float),
indexing='ij')
if self.vectors_style.get('threshold', None) is not None:
select = self.sources[0][self.sourceSlice()] > self.vectors_style.get('threshold')
vx, vy = vx[select], vy[select]
x, y = x[select], y[select]
else:
vx, vy = vx.flatten(), vy.flatten()
x, y = x.flatten(), y.flatten()
x += 0.5
y += 0.5
px, py = np.zeros(x.shape[0] * 2), np.zeros(y.shape[0] * 2)
px[0::2] = x
px[1::2] = x + vx
py[0::2] = y
py[1::2] = y + vy
path = pg.arrayToQPath(px, py, 'pairs')
if self.vectors_item is not None:
self.view.removeItem(self.vectors_item)
self.vectors_item = QGraphicsPathItem(path)
self.vectors_item.setPen(pg.mkPen(self.vectors_style.get('brush')))
self.view.addItem(self.vectors_item)
self.vectors_base_item.setData(x=x, y=y)
[docs]
def change_vectors_threshold(self, value=None):
if value is not None:
self.vectors_threshold_edit.setText('%d' % value)
text = self.vectors_threshold_edit.text()
# print('text=',text)
try:
value = float(text)
except ValueError:
value = None
self.vectors_style['threshold'] = value
self.updateSlice(force_update=True)
[docs]
def change_vectors_color(self):
color = self.vectors_color_button.color()
self.vectors_style['brush'] = color
self.vectors_item.setPen(pg.mkPen(self.vectors_style['brush']))
self.vectors_base_item.setBrush(self.vectors_style['brush'])
[docs]
def set_orientations(self, orientations):
self.orientations = orientations
self.update_orientations()
self.orientations_color_button.setVisible(True)
self.orientations_threshold_edit.setVisible(True)
[docs]
def update_orientations(self):
if self.orientations is not None:
orientations = self.orientations
axis = self.source_axis
index = self.source_index[axis]
slicing = tuple(slice(None) if a != axis else index for a in range(3))
axes = [d for d in range(3) if d != axis]
vx, vy = [orientations[slicing + (a,)] for a in axes]
x, y = np.meshgrid(np.arange(orientations.shape[axes[0]], dtype=float),
np.arange(orientations.shape[axes[1]], dtype=float), indexing='ij')
if self.orientations_style.get('threshold', None) is not None:
select = self.sources[0][self.sourceSlice()] > self.orientations_style.get('threshold')
vx, vy = vx[select], vy[select]
x, y = x[select], y[select]
else:
vx, vy = vx.flatten(), vy.flatten()
x, y = x.flatten(), y.flatten()
x += 0.5
y += 0.5
px, py = np.zeros(x.shape[0] * 2), np.zeros(y.shape[0] * 2)
l = 0.45
px[0::2] = x - l * vx
px[1::2] = x + l * vx
py[0::2] = y - l * vy
py[1::2] = y + l * vy
path = pg.arrayToQPath(px, py, 'pairs')
if self.orientations_item is not None:
self.view.removeItem(self.orientations_item)
self.orientations_item = QGraphicsPathItem(path)
self.orientations_item.setPen(pg.mkPen(self.orientations_style.get('pen')))
self.view.addItem(self.orientations_item)
[docs]
def change_orientations_threshold(self, value=None):
if value is not None:
self.orientations_threshold_edit.setText('%d' % value)
text = self.orientations_threshold_edit.text()
# print('text=',text)
try:
value = float(text)
except ValueError:
value = None
self.orientations_style['threshold'] = value
self.updateSlice(force_update=True)
[docs]
def change_orientations_color(self):
color = self.orientations_color_button.color()
self.orientations_style['pen'] = color
self.orientations_item.setPen(self.orientations_style['pen'])
[docs]
def set_color_scheme(self, type_, lut=0):
self.luts[lut].lut.item.gradient.loadPreset(type_)
[docs]
def enable_mouse_clicks(self):
self.graphicsView.scene().sigMouseClicked.connect(self.handleMouseClick)
[docs]
def handleMouseClick(self, event):
event.accept()
x, y = self.get_coords(event.scenePos())
btn = event.button()
if btn != 1:
return
x_axis, y_axis = self.getXYAxes()
scaled_x, scaled_y = self.scale_coords(x, x_axis, y, y_axis)
self.mouse_clicked.emit(scaled_x, scaled_y, self.source_index[self.scroll_axis])
[docs]
def padded_shape(self, shape):
pad_size = max(3, len(shape))
return (shape + (1,) * pad_size)[:pad_size]
[docs]
def save_screenshot(self, *_):
"""
Save a PNG/JPEG/TIFF screenshot of the current viewer.
By default, captures just the central image area (graphicsView).
Switch to `self.grab()` below if you want the whole window (incl. LUTs).
"""
# Grab the rendered view (image + overlays)
# TODO: full/image_only combobox to select between self.graphicsView.grab() and self.grab() for full window
pixmap = self.graphicsView.grab()
# Build a friendly default name with title, slice index, timestamp
try:
title = self.windowTitle() or "DataViewer"
except Exception:
title = "DataViewer"
for forbidden_char in ['<', '>', ':', '"', '/', '\\', '|', '?', '*', ' ']:
title = title.replace(forbidden_char, "_")
z = str(int(self.source_index[self.scroll_axis])).zfill(4)
now = datetime.now().strftime("%Y%m%d_%H%M%S")
suggested = f"{title}_z{z}_{now}.png"
dest_path, _ = QFileDialog.getSaveFileName(self, 'Save screenshot', suggested,
'PNG (*.png);;JPEG (*.jpg *.jpeg);;TIFF (*.tif *.tiff)')
if not dest_path:
return
ok = pixmap.save(dest_path)
if not ok:
pixmap.save(dest_path, 'PNG')
# def __cast_bools(self):
# for i, s in enumerate(self.sources):
# if s.dtype == bool:
# self.sources[i] = s.view('uint8')
# def __ensure_3d(self):
# for i, s in enumerate(self.sources):
# if s.ndim == 2:
# s = s.view()
# s.shape = s.shape + (1,)
# self.sources[i] = s
# if s.ndim != 3:
# raise RuntimeError(f"Sources don't have dimensions 2 or 3 but {s.ndim} in source {i}!")
############################################################################################################
# ## Tests
############################################################################################################
def _test():
import numpy as np
import ClearMap.Visualization.Qt.DataViewerAxon as dv
from importlib import reload
reload(dv)
img1 = np.random.rand(*(100, 80, 30))
if not runs_on_spyder():
pg.mkQApp()
DataViewer(img1)
if not runs_on_spyder():
instance = QApplication.instance()
instance.exec_()
points = np.array(np.where(img1 > 0.99)).T
points.shape
vectors = np.random.rand(*(img1.shape + (3,)))
# %gui qt
reload(dv)
dv.DataViewer(img1, points=points, vectors=vectors)
if __name__ == '__main__':
print('testing')
_test()
time.sleep(60)