Package Organisation#
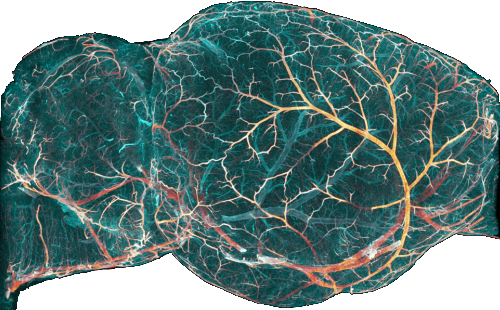
ClearMap is designed for advanced and fast image processing of large (terabyte) 3-D datasets obtained from tissue clearing [Kirst2020] [Renier2016].
The modular source management allows unified handling of various data sources (image files, memory maps, shared memory arrays, numpy arrays, GPU arrays, graph formats) and fast parallel 3-D image and graph processing as well as interactive visualisation of large 3-D images.
ClearMap is open-source software released under the GPL v3 licence.
Architecture overview#
ClearMap 3.1 is organised into three layers:
- Pipeline orchestrators (
pipeline_orchestrators) High-level workers that implement each processing pipeline end-to-end. These are what the GUI drives and what advanced users call directly in scripts. Each orchestrator reads its parameters from YAML config files and writes outputs through the workspace.
Key classes:
SampleManager— root object for a single experiment (channel definitions, workspace reconciliation, channel queries).ExperimentController— wires config, sample manager, and all workers together; single entry point for UI patches.CellDetector— cell detection, filtering, atlas alignment, voxelization.BinaryVesselProcessor/VesselGraphProcessor— vessel binarization, graph construction, and annotation.TractMapProcessor— myelinated-tract binarization and coordinate mapping.ColocalizationProcessor— nearest-neighbour colocalization between channel pairs.RegistrationProcessor— resampling and Elastix-based atlas registration.StitchingProcessor— rigid and wobbly stitching.
- Configuration system (
config) YAML-based configuration with in-memory working model, atomic commits, JSON-schema validation, and automatic derivation of dependent fields via config adjusters.
ConfigCoordinator— central coordinator (apply → adjust → validate → commit).ConfigHandler— file resolution and IO for YAML / ConfigObj / JSON.DefaultsProvider— three-level default precedence (user → packaged → code).
- Workspace and assets (
workspace2,workspace_asset) Channel-centred workspace that maps (channel, asset_type) pairs to on-disk
Assetobjects.Workspace2— the workspace itself (persisted asworkspace.yml).Asset— a single logical file or folder.
Modules#
Alignment — stitching, resampling, and registration
Analysis — measurements and statistical analysis
ImageProcessing — correcting and quantifying image data
IO — reading and writing data
ParallelProcessing — organising parallel processing
Visualization — visualising data and results
Alignment#
The ClearMap.Alignment module includes methods for
3d resampling:
3d alignment to reference atlases (e.g. Allen Brain Institute Atlases) via interfacing to elastix:
3d rigid and wobbly stitching via WobblyStitcher:
Analysis#
The Analysis module provides methods for the
quantification and analysis of the data, including:
graph and network analysis for very large graphs
enabling:
graph preprocessing and cleanup
graph branch reduction
graph annotation
graphs embedded in 3-D space
3-D graphs with 3-D edge geometry
graph vertex and edge label morphological operations
sub-graph extraction
network analysis
colocalization analysis between fluorescence channels
measurement routines to quantify the results
enabling:
measurements of expression levels
measurements of geometric shapes and radii
maxima detection
voxelization
statistics routines to analyse the results
vasculature-specific analysis utilities
ImageProcessing#
The ImageProcessing module is the core of ClearMap
and provides methods to process 3-D images of TB size, including:
binary image processing
with filling and discrete topology-based binary smoothing routines:
clipping and normalisation
3-D local gradients and Hessian matrices
with 3-D tube filter and tubeness measures:
3-D filtering
with 3-D rank filter library (>30 filters):
skeletonization via parallel thinning
3-D tracing
fast calculation of 3-D local image statistics
hysteresis and seeded thresholding
light-sheet artifact removal
illumination correction
machine learning based image processing
with vessel and tube filling deep convolutional neural network:
expert processing pipelines for specific applications
IO#
The IO module provides a unified interface to read and
write data in any format that ClearMap supports. All format dispatch is
handled by IO so calling code never needs to import
format-specific modules directly. It is organised around the core concept
of the Source which allow slicing and conversion to and from virtual sources,
the cornerstone of ClearMaps parallel processing
Sources and sinks:
Workspace and assets (new in v3):
workspace2— channel-centred workspaceworkspace_asset— on-disk asset modelassets_constants— asset type registryassets_specs— TypeSpec, ChannelSpec, StateManager
Supported source types:
Format |
Module |
Description |
|---|---|---|
tif |
tif images and stacks |
|
raw / mhd |
raw image files with optional mhd header file |
|
nrrd |
nearly raw raster data files |
|
csv |
text files as comma separated values |
|
npy |
numpy binary file |
|
gt |
graph tool file |
|
file list |
folder, file list or file expression for source files |
|
- |
memory mapped file |
|
- |
shared memory array |
ParallelProcessing#
The ParallelProcessing module provides methods for
distributed processing.
large data arrays can be processed in blocks via a specialised IO source
or via shared memory arrays
numerical processing routines for TB data arrays are collected in
including speed-ups for numpy array processing, convolution and measurement routines:
Visualization#
ClearMap.Visualization comes with a large set of interactive
visualisation functions using various backends:
-
providing:
fast interactive 2-D slice plotting of 3-D TB datasets
overlays and/or synchronised window display of multiple datasets
scatter overlays with depth display and atlas-region colouring
-
providing:
3-D volume rendering, list and line plots
3-D graph plots as lines or mesh with edge geometries
GUI#
The gui package provides a PyQt5-based graphical user
interface that exposes every pipeline step without requiring scripting.
See GUI usage for a full walkthrough.