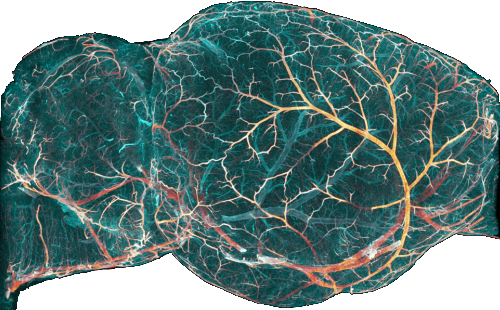
plot_graph_3d#
Plotting routines for 3d display of graphs.
Note
This module is using vispy.
- plot_graph_edge_geometry_property(graph, property_or_name, reduction_fn=None, colormap='viridis', mesh=False, alpha=1, view=None, **kwargs)[source]#
- plot_graph_edge_property(graph, edge_property, colormap=None, mesh=False, percentiles=None, clip=None, normalize=None, cycle_colors=False, bg_color='white', show=True, **kwargs)[source]#
- plot_graph_line(graph, view=None, coordinates=None, color=None, edge_colors=None, vertex_colors=None, bg_color='white', width=None, mode='gl', center_view=True, title=None, show=True, **kwargs)[source]#
Plot a graph as 3d lines.
Arguments
- graphGraph
The graph to plot.
- titlestr or None
Window title.
- viewview or None
Add plot to this view if supplied
Returns
- viewview
The view of the plot.
- plot_graph_mesh(graph, view=None, coordinates=None, radii=None, color=None, vertex_colors=None, edge_colors=None, n_tube_points=8, default_radius=1.0, mode='triangles', shading='smooth', show=True, bg_color='white', center_view=True, title=None, **kwargs)[source]#
Plot a graph as a 3d mesh.
Arguments
- graphGraph
The graph to plot.
- titlestr or None
Window title.
- viewview or None
Add plot to this view. if given.
Returns
- viewview
The view of the plot.
- plot_graph_nodes(graph, view=None, coordinates=None, radii=None, color=None, vertex_colors=None, colormap='Set1', n_sphere_points=8, default_radius=1, use_geometry=False, mode='triangles', shading='smooth', show=True, bg_color='white', center_view=True, title=None, **kwargs)[source]#
Plot vertices (or geometry sample points) of a graph as 3-D balls.
- Parameters:
graph (Graph) – The graph to plot.
view (vispy.scene.widgets.ViewBox | None) – Existing view to which the visual is appended (a new one is created when None).
coordinates (str | None) – Name of the vertex-property that stores coordinates.
radii (str | 1-d array | None) – Vertex property or explicit radii array. Falls back to
graph.vertex_radii()or default_radius.color (array-like or color spec) – Global or per-vertex colour(s). Same semantics as the other helpers.
vertex_colors (array-like or color spec) – Global or per-vertex colour(s). Same semantics as the other helpers.
n_sphere_points (int) – Subdivisions per sphere (≥4).
default_radius (float) – Uniform radius if none are stored in the graph.
use_geometry (bool) – If True the function plots every sample point contained in an edge-geometry instead of the plain vertex set.
mode (str) – Rendering options forwarded to the underlying MeshVisual.
shading (str) – Rendering options forwarded to the underlying MeshVisual.
show (bool) – Whether to show the canvas immediately when a new one is created.
bg_color (str | tuple) – Canvas background colour.
center_view (bool) – If True centres the camera on the mean vertex coordinate.
title (str | None) – Window title when a new canvas is created.
**kwargs – Forwarded to
GraphSphereVisual.
Returns
- BallVisual
The created visual (handy for subsequent manipulation).