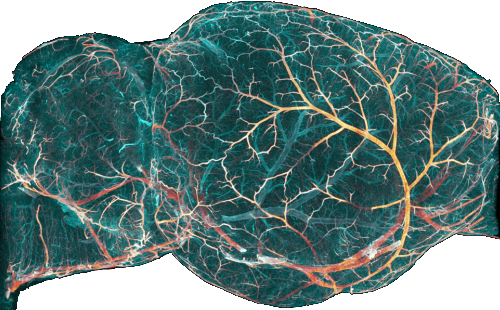
# -*- coding: utf-8 -*-
"""
PlotGraph3d Module
------------------

Plotting routines for 3d display of graphs.

Note
----
This module is using vispy.
"""
__author__ = 'Christoph Kirst <ckirst@rockefeller.edu>'
__license__ = 'MIT License <https://www.opensource.org/licenses/mit-license.php>'
__copyright__ = 'Copyright (c) 2017 by Christoph Kirst, The Rockefeller University, New York City'


import numpy as np

import vispy
import vispy.scene
from matplotlib import pyplot as plt

import ClearMap.Visualization.Vispy.Plot3d as p3d
from ClearMap.Visualization.Vispy import graph_visual
import ClearMap.Visualization.Color as col

###############################################################################
# ## Plotting
###############################################################################


[docs]
def get_colormap(colormap):
    if colormap is None:
        colormap = col.colormap('viridis')
    elif isinstance(colormap, str):
        if colormap in plt.colormaps():
            colormap = plt.get_cmap(colormap)
        else:
            colormap = col.colormap(colormap)
    return colormap


[docs]
def plot_graph_nodes(graph, view=None, coordinates=None,
                     radii=None,
                     color=None, vertex_colors=None, colormap='Set1',
                     n_sphere_points=8, default_radius=1,
                     use_geometry=False,
                     mode='triangles', shading='smooth',
                     show=True, bg_color='white',
                     center_view=True, title=None, **kwargs):
    """
    Plot vertices (or geometry sample points) of a graph as 3-D balls.

    Parameters
    ----------
    graph : Graph
        The graph to plot.
    view : vispy.scene.widgets.ViewBox | None
        Existing view to which the visual is appended (a new one is created
        when *None*).
    coordinates : str | None
        Name of the vertex-property that stores coordinates.
    radii : str | 1-d array | None
        Vertex property or explicit radii array.  Falls back to
        ``graph.vertex_radii()`` or *default_radius*.
    color, vertex_colors : array-like or color spec
        Global or per-vertex colour(s).  Same semantics as the other helpers.
    n_sphere_points : int
        Subdivisions per sphere (≥4).
    default_radius : float
        Uniform radius if none are stored in the graph.
    use_geometry : bool
        If *True* the function plots every sample point contained in an
        edge-geometry instead of the plain vertex set.
    mode, shading : str
        Rendering options forwarded to the underlying MeshVisual.
    show : bool
        Whether to show the canvas immediately when a new one is created.
    bg_color : str | tuple
        Canvas background colour.
    center_view : bool
        If *True* centres the camera on the mean vertex coordinate.
    title : str | None
        Window title when a new canvas is created.
    **kwargs
        Forwarded to :class:`GraphSphereVisual`.

    Returns
    -------
    BallVisual
        The created visual (handy for subsequent manipulation).
    """
    if vertex_colors is not None:
        vertex_colors = vertex_colors.astype(int)
    # -------------------------------------------------------------------------
    # Build the Visual-Node class
    # -------------------------------------------------------------------------
    GraphSphere = vispy.scene.visuals.create_visual_node(graph_visual.GraphSphereVisual)

    # -------------------------------------------------------------------------
    # Canvas / View initialisation
    # -------------------------------------------------------------------------
    title = 'plot_graph_nodes' if title is None else title
    view = p3d.initialize_view(view, title=title, depth_value=100000000, fov=100, distance=0,
                               elevation=0, azimuth=0, show=show, bg_color=bg_color)


    if vertex_colors is None:
        vertex_colors = np.repeat(([0.6, 0.6, 0.6, 1.0], ), graph.n_vertices, axis=0)

    if vertex_colors.ndim == 1:
        colormap = get_colormap(colormap)
        vertex_colors = colormap(vertex_colors % colormap.N)

    # -------------------------------------------------------------------------
    # Instantiate the visual
    # -------------------------------------------------------------------------
    p = GraphSphere(graph, parent=view.scene, coordinates=coordinates, radii=radii,
                    color=color, vertex_colors=vertex_colors,
                    n_sphere_points=n_sphere_points, default_radius=default_radius,
                    use_geometry=use_geometry, mode=mode, shading=shading, **kwargs)

    # -------------------------------------------------------------------------
    # Optional camera centring
    # -------------------------------------------------------------------------
    if center_view:
        view.camera.center = np.mean(graph.vertex_coordinates(), axis=0)

    return p


[docs]
def plot_graph_mesh(graph, view=None, coordinates=None, radii=None,
                    color=None, vertex_colors=None, edge_colors=None,
                    n_tube_points=8, default_radius=1.0,
                    mode='triangles', shading='smooth',
                    show=True, bg_color='white',
                    center_view=True, title=None, **kwargs):
    """Plot a graph as a 3d mesh.

    Arguments
    ---------
    graph : Graph
        The graph to plot.
    title : str or None
        Window title.
    view : view or None
        Add plot to this view. if given.

    Returns
    -------
    view : view
        The view of the plot.
    """
    # build visuals
    GraphMesh = vispy.scene.visuals.create_visual_node(graph_visual.GraphMeshVisual)

    title = title if title is not None else 'plot_graph_mesh'
    view = p3d.initialize_view(view, title=title, depth_value=100000000,
                               fov=100, distance=0, elevation=0, azimuth=0, show=show, bg_color=bg_color)

    p = GraphMesh(graph, parent=view.scene,
                  coordinates=coordinates, radii=radii,
                  color=color, vertex_colors=vertex_colors, edge_colors=edge_colors,
                  shading=shading, mode=mode, n_tube_points=n_tube_points,
                  default_radius=default_radius, **kwargs)

    if center_view:
        view.camera.center = np.mean(graph.vertex_coordinates(), axis=0)

    return p


[docs]
def plot_graph_line(graph, view=None, coordinates=None,
                    color=None, edge_colors=None, vertex_colors=None, bg_color='white',
                    width=None, mode='gl', center_view=True, title=None, show=True, **kwargs):
    """
    Plot a graph as 3d lines.

    Arguments
    ---------
    graph : Graph
        The graph to plot.
    title : str or None
        Window title.
    view : view or None
       Add plot to this view if supplied

    Returns
    -------
    view : view
        The view of the plot.
    """
    # build visuals
    GraphLine = vispy.scene.visuals.create_visual_node(graph_visual.GraphLineVisual)

    title = title if title is not None else 'plot_graph_line'
    view = p3d.initialize_view(view, title=title, depth_value=100000000,
                               fov=100, distance=0, elevation=0, azimuth=0, show=show, bg_color=bg_color)

    width = width if width is not None else 1

    p = GraphLine(graph, parent=view.scene,
                  coordinates=coordinates,
                  color=color, vertex_colors=vertex_colors, edge_colors=edge_colors,
                  width=width, mode=mode, **kwargs)

    if center_view:
        view.camera.center = np.mean(graph.vertex_coordinates(), axis=0)

    return p

# FIXME: add alpha argument


[docs]
def plot_graph_edge_property(graph, edge_property, colormap=None, mesh=False,
                             percentiles=None, clip=None, normalize=None, cycle_colors=False,
                             bg_color='white', show=True, **kwargs):
    if isinstance(edge_property, str) and edge_property in graph.edge_properties:
        edge_property = graph.edge_property(edge_property)
    if cycle_colors:
        edge_colors = np.array(edge_property, dtype=int)
    else:
        edge_colors = np.array(edge_property, dtype=float)  #  Prop needs to be [0,1] for colormap to work

    if percentiles is not None:
        clip = np.percentile(edge_colors, percentiles)

    if clip is not None:
        lo, hi = clip
        edge_colors = np.clip(edge_colors, lo, hi)

    if normalize is not None:
        edge_colors -= np.min(edge_colors)
        edge_colors /= np.max(edge_colors)

    colormap = get_colormap(colormap)

    if cycle_colors:
        edge_colors = colormap(edge_colors % colormap.N)
    else:
        edge_colors = colormap(edge_colors)

    if mesh:
        return plot_graph_mesh(graph, edge_colors=edge_colors, bg_color=bg_color, show=show, **kwargs)
    else:
        return plot_graph_line(graph, edge_colors=edge_colors, bg_color=bg_color, show=show, **kwargs)


[docs]
def plot_graph_vertex_property(graph, vertex_property, colormap=None, bg_color='white', show=True, **kwargs):
    if isinstance(vertex_property, str) and vertex_property in graph.vertex_properties:
        vertex_property = graph.vertex_property(vertex_property)
    # vertex_colors = np.array(vertex_property, dtype=float)
    vertex_colors = np.array(vertex_property, dtype=int)

    return plot_graph_nodes(graph, vertex_colors=vertex_colors, bg_color=bg_color,
                            colormap=colormap, show=show, **kwargs)


[docs]
def plot_graph_edge_geometry_property(graph, property_or_name, reduction_fn=None, colormap='viridis',
                                      mesh=False, alpha=1, view=None, **kwargs):
    if reduction_fn is None:
        raise NotImplementedError(
            'Plotting edge geometry values directly is not implemented yet. A reduction function must be '
            'provided to reduce edge geometry labels first. For example, use np.mean or np.max.')
    if isinstance(property_or_name, str) and property_or_name in graph.edge_geometry_properties:
        edge_geom_labels = graph.edge_geometry(property_or_name, as_list=True)
    else:
        raise NotImplementedError(f'Passing edge geometry property as a list or array is not implemented yet. ')

    colormap = get_colormap(colormap)

    # Reduce edge geometry labels (ints required for modulo operation)
    edge_geom_labels = np.array([reduction_fn(lbls) for lbls in edge_geom_labels], dtype=int)
    # Compute the colors applied to the REDUCED edges from the reduction of edge geometry labels.
    edge_colors = colormap(edge_geom_labels % colormap.N)
    edge_colors[..., 3] = alpha

    plot_fn = plot_graph_mesh if mesh else plot_graph_line

    plot_fn(graph, edge_colors=edge_colors, view=view, **kwargs)


###############################################################################
# ## Tests
###############################################################################

def _test():
    from importlib import reload
    import numpy as np

    from ClearMap.Analysis.graphs import graph_processing
    import ClearMap.Visualization.Vispy.plot_graph_3d as pg3

    reload(pg3)
    # g = gr.load('/home/ckirst/Desktop/Vasculature/Analysis_2018_03_27/stitched_graph_transformed.gt')
    # g = gr.load('/home/ckirst/Science/Projects/WholeBrainClearing/Vasculature/Experiment/Graphs_2018_05/graph_reduced.gt')

    g = graph_processing.ggt.Graph(n_vertices=10)
    g.add_edge(np.array([[7,8],[7,9],[1,2],[2,3],[3,1],[1,4],[4,5],[2,6],[6,7]]))
    g.set_vertex_coordinates(np.array([[10,10,10],[0,0,0],[1,1,1],[1,1,0],[5,0,0],[8,0,1],[0,7,1],[0,10,2],[0,12,3],[3,7,7]], dtype=float))
    gc = graph_processing.clean_graph(g)
    gr = graph_processing.reduce_graph(gc, compute_edge_geometry=True, edge_geometry_vertex_properties=['coordinates'])

    edge_colors = np.random.rand(gr.n_edges, 4)
    edge_colors[:, 3] = 1.0

    pg3.plot_graph_mesh(gr, edge_colors=edge_colors)

    edge_colors = np.random.rand(g.n_edges, 4)
    edge_colors[:, 3] = 1.0

    pg3.plot_graph_line(g, edge_color=edge_colors)