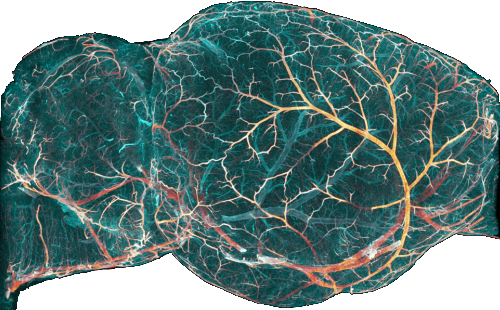
graph_visual#
Module providing Graph visuals for rendering graphs.
Note
This module is providing vispy visuals only.
See PlotGraph3d module for plotting.
- class GraphLineVisual(graph, coordinates=None, color=None, vertex_colors=None, edge_colors=None, width=None, mode='gl')[source]#
Bases:
LineVisualDisplays a graph in 3d using tube rendering for the edges
- class GraphMeshVisual(graph, coordinates=None, radii=None, n_tube_points=8, default_radius=1, color=None, vertex_colors=None, edge_colors=None, mode='triangles', shading='smooth')[source]#
Bases:
MeshVisualDisplays a graph in 3d using tube rendering for the edges
- class GraphSphereVisual(graph, coordinates=None, radii=None, n_sphere_points=8, default_radius=1, color=None, vertex_colors=None, use_geometry=False, mode='triangles', shading='smooth')[source]#
Bases:
MeshVisualRender each vertex (or geometry sample-point) of a graph as a shaded 3-D sphere.
- Parameters:
graph (Graph) – The graph to visualise.
coordinates (str | None) – Name of the (vertex- or geometry-)property that stores XYZ positions.
radii (str | 1-d array | None) – Property name or explicit per-point radii. Falls back to
graph.vertex_radii()or default_radius.n_sphere_points (int) – Number of longitudinal subdivisions (≥ 4). Latitudinal subdivisions are chosen automatically to give a roughly regular mesh.
default_radius (float) – Uniform radius to use when no radii are stored.
color (colour spec or array) – Global or per-vertex colours (same semantics as the other visuals).
vertex_colors (colour spec or array) – Global or per-vertex colours (same semantics as the other visuals).
use_geometry (bool) – If True plot every edge-geometry sample-point instead of the plain vertex set.
mode (str) – Passed straight to
vispy.visuals.MeshVisual.shading (str) – Passed straight to
vispy.visuals.MeshVisual.