# -*- coding: utf-8 -*-
"""
GraphVisual
===========

Module providing Graph visuals for rendering graphs.

Note
----
This module is providing vispy visuals only.
See :mod:`PlotGraph3d` module for plotting.
"""
__author__ = 'Christoph Kirst <ckirst@rockefeller.edu>'
__license__ = 'MIT License <https://www.opensource.org/licenses/mit-license.php>'
__copyright__ = 'Copyright (c) 2017 by Christoph Kirst, The Rockefeller University, New York City'


import numpy as np

import vispy.visuals as visuals
from vispy.geometry import create_sphere

import ClearMap.Visualization.Color as col
from ClearMap.Analysis.graphs.graph_rendering import mesh_tube_from_coordinates_and_radii


###############################################################################
# ## Graph visuals
###############################################################################

default_color = (0.8, 0.1, 0.1, 1.0)


[docs]
class GraphLineVisual(visuals.LineVisual):
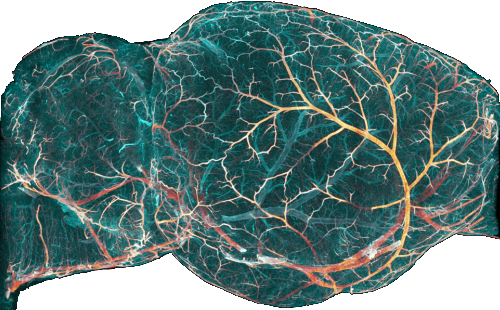
    """Displays a graph in 3d using tube rendering for the edges
    """

    def __init__(self, graph,
                 coordinates=None,
                 color=None, vertex_colors=None, edge_colors=None,
                 width=None, mode='gl'):

        connectivity = graph.edge_connectivity()

        if coordinates is None:
            name = 'coordinates'
        else:
            name = coordinates
        coordinates = graph.vertex_property(name)

        if vertex_colors is not None or edge_colors is not None:
            color = None
        if color is None:
            if edge_colors is None and vertex_colors is None:
                color = default_color
            elif vertex_colors is not None:
                if isinstance(vertex_colors, np.ndarray) and vertex_colors.ndim == 2:
                    color = vertex_colors
                else:
                    color = col.color(vertex_colors, alpha=True)
            elif edge_colors is not None:
                if isinstance(edge_colors, np.ndarray) and edge_colors.ndim == 2:
                    # need a vertex pair for every edge if the color is different
                    coordinates = coordinates[connectivity.flatten()]
                    connectivity = np.arange(coordinates.shape[0])
                    connectivity = connectivity.reshape((-1, 2))
                    indices = np.arange(len(edge_colors))
                    indices = np.array([indices, indices]).T.flatten()
                    color = edge_colors[indices]
                else:
                    color = col.color(edge_colors, alpha=True)
        else:
            color = col.color(color, alpha=True)

        if width is None:
            width = 1

        visuals.LineVisual.__init__(self, coordinates, connect=connectivity,
                                    color=color, width=width, method=mode)


[docs]
class GraphMeshVisual(visuals.mesh.MeshVisual):
    """Displays a graph in 3d using tube rendering for the edges"""

    def __init__(self, graph,
                 coordinates=None, radii=None,
                 n_tube_points=8, default_radius=1,
                 color=None, vertex_colors=None, edge_colors=None,
                 mode='triangles', shading='smooth'):

        if vertex_colors is not None or edge_colors is not None:
            color = None

        if color is None and vertex_colors is None:
            color = default_color

        if graph.has_edge_geometry(coordinates if coordinates is not None else 'coordinates'):
            name = coordinates if coordinates is not None else 'coordinates'
            coordinates, indices = graph.edge_geometry(name=name, return_indices=True, as_list=False)

            # calculate mesh
            try:
                radius_name = 'radius_units' if 'radius_units' in graph.edge_geometry_properties else 'radii'
                name = radii if radii is not None else radius_name
                radii = graph.edge_geometry(name=name, return_indices=False, as_list=False)
            except:  # FIXME: broad
                radii = self.use_default_radii(coordinates, default_radius)
        else:
            coordinates = graph.vertex_coordinates()
            indices = graph.edge_connectivity().flatten()
            coordinates = np.vstack(coordinates[indices])
            try:
                radii = graph.vertex_radii()
                radii = radii[indices]
            except:  # FIXME: broad
                radii = self.use_default_radii(coordinates, default_radius)

            n_edges = graph.n_edges
            indices = np.array([2*np.arange(0, n_edges), 2*np.arange(1, n_edges+1)]).T

        if vertex_colors is not None:    # then, edges take as colors the average of their vertices colours
            connectivity = graph.edge_connectivity()
            edge_colors = (vertex_colors[connectivity[:, 0]] + vertex_colors[connectivity[:, 1]])/2.0

        vertices, faces, vertex_colors = mesh_tube_from_coordinates_and_radii(coordinates, radii, indices,
                                                                              n_tube_points=n_tube_points,
                                                                              edge_colors=edge_colors,
                                                                              processes=None)

        visuals.mesh.MeshVisual.__init__(self, vertices, faces,
                                         color=color, vertex_colors=vertex_colors,
                                         shading=shading, mode=mode)


[docs]
    def use_default_radii(self, coordinates, default_radius):
        print(f'No radii found in the graph, using uniform radii = {default_radius}!')
        radii = np.full(coordinates.shape[0], default_radius)
        return radii


[docs]
class GraphSphereVisual(visuals.mesh.MeshVisual):
    """
    Render each vertex (or geometry sample-point) of a graph as a shaded 3-D
    sphere.

    Parameters
    ----------
    graph : Graph
        The graph to visualise.
    coordinates : str | None
        Name of the (vertex- or geometry-)property that stores XYZ positions.
    radii : str | 1-d array | None
        Property name or explicit per-point radii.  Falls back to
        ``graph.vertex_radii()`` or *default_radius*.
    n_sphere_points : int
        Number of longitudinal subdivisions (≥ 4).  Latitudinal subdivisions
        are chosen automatically to give a roughly regular mesh.
    default_radius : float
        Uniform radius to use when no radii are stored.
    color, vertex_colors : colour spec or array
        Global or per-vertex colours (same semantics as the other visuals).
    use_geometry : bool
        If *True* plot every edge-geometry sample-point instead of the plain
        vertex set.
    mode, shading : str
        Passed straight to ``vispy.visuals.MeshVisual``.
    """

    def __init__(self, graph,
                 coordinates=None, radii=None,
                 n_sphere_points=8, default_radius=1,
                 color=None, vertex_colors=None,
                 use_geometry=False,
                 mode='triangles', shading='smooth'):

        # -------------------------------------------------------------
        # ---  Collect coordinates ------------------------------------
        # -------------------------------------------------------------
        name = coordinates if coordinates is not None else 'coordinates'
        if use_geometry and graph.has_edge_geometry(name):
            coords = graph.edge_geometry(name=name, as_list=False)
        else:
            coords = graph.vertex_property(name)  # falls back to vertex_coordinates()

        coords = np.asarray(coords, dtype=float)
        n_points = coords.shape[0]

        # -------------------------------------------------------------
        # ---  Collect radii -----------------------------------------
        # -------------------------------------------------------------
        if radii is None:
            try:                     # vertices
                radius_name = 'radius_units' if 'radius_units' in graph.edge_geometry_properties else 'radii'
                radii = graph.vertex_property(radius_name) if not use_geometry else graph.edge_geometry(name=radius_name, as_list=False)
            except Exception:  # FIXME: too broad
                radii = None

        if isinstance(radii, str):   # property name
            radii = graph.vertex_property(radii) \
                    if not use_geometry else graph.edge_geometry(name=radii, as_list=False)

        if radii is None:
            radii = np.full(n_points, default_radius, dtype=float)
        else:
            radii = np.asarray(radii, dtype=float)
            if radii.size != n_points:          # broadcast scalar or 1-value list
                if radii.size == 1:
                    radii = np.full(n_points, float(radii.squeeze()))
                else:
                    raise ValueError('Length of *radii* must match number of points.')

        # -------------------------------------------------------------
        # ---  Generate one unit sphere mesh --------------------------
        # -------------------------------------------------------------
        rows = max(4, int(n_sphere_points))
        cols = rows * 2                      # decent aspect ratio
        md = create_sphere(rows=rows, cols=cols, radius=1.0)
        sph_verts = md.get_vertices()
        sph_faces = md.get_faces()
        n_template_verts = sph_verts.shape[0]
        n_template_faces = sph_faces.shape[0]

        # -------------------------------------------------------------
        # ---  Replicate & transform template for every centre --------
        # -------------------------------------------------------------
        # vertices
        verts = np.repeat(sph_verts[np.newaxis, :, :], n_points, axis=0)
        verts *= radii[:, np.newaxis, np.newaxis]
        verts += coords[:, np.newaxis, :]
        verts = verts.reshape(-1, 3)

        # faces (need index offset per sphere)
        offsets = np.arange(n_points, dtype=int) * n_template_verts
        faces = sph_faces[np.newaxis, :, :] + offsets[:, np.newaxis, np.newaxis]
        faces = faces.reshape(-1, 3)

        # -------------------------------------------------------------
        # ---  Handle colours ----------------------------------------
        # -------------------------------------------------------------
        if vertex_colors is not None:
            # explicit per-point colours ------------------------------------------------
            if not isinstance(vertex_colors, np.ndarray):
                vertex_colors = col.color(vertex_colors, alpha=True)

            if vertex_colors.ndim == 1:                # single RGBA colour for *all* points
                vertex_colors = np.tile(vertex_colors, (n_points, 1))
            elif vertex_colors.shape[0] != n_points:   # sanity check
                raise ValueError('vertex_colors must have one entry per point.')

            # replicate colour of each point to all vertices of its sphere
            vcols = np.repeat(vertex_colors, n_template_verts, axis=0).astype(float)
            color_kw = dict(vertex_colors=vcols, color=None)
        else:
            # uniform colour ------------------------------------------------------------
            if color is None:
                color = default_color
            color_kw = dict(color=col.color(color, alpha=True), vertex_colors=None)

        # -------------------------------------------------------------
        # ---  Initialise parent MeshVisual ---------------------------
        # -------------------------------------------------------------
        visuals.mesh.MeshVisual.__init__(self,
                                         verts, faces,
                                         shading=shading,
                                         mode=mode,
                                         **color_kw)


###############################################################################
# ## Tests
###############################################################################

def _test():
    import numpy as np

    import vispy

    import ClearMap.Analysis.graphs.graph_gt as ggt
    import ClearMap.Visualization.Vispy.Plot3d as p3d
    import ClearMap.Visualization.Vispy.graph_visual as gv
    # reload(gv)

    g = ggt.Graph()
    g.add_vertex(5)
    g.add_edge([[0, 1], [1, 2], [2, 3], [3, 4], [4, 0]])
    g.set_vertex_coordinates(20*np.random.rand(5, 3))

    v = vispy.scene.visuals.create_visual_node(gv.GraphLineVisual)
    p = v(g, parent=p3d.initialize_view().scene)
    p3d.center(p)

    v = vispy.scene.visuals.create_visual_node(gv.GraphMeshVisual)
    p = v(g, parent=p3d.initialize_view().scene)
    p3d.center(p)