ClearMap.Visualization.Vispy#
This sub-package provides Vispy-GUI interfaces for ClearMap
Supported functionality:
3d plotting of point clouds, lines, meshes
3d plotting of volumetric data (array size limited by graphics card)
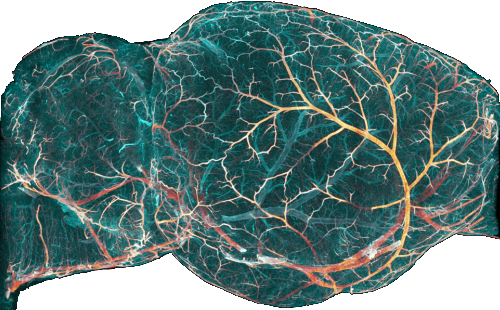
3d plotting of graph based geometries and meshes
- Main routines are:
list_line_plot_3d().list_plot_3d().plot_3d().plot_graph_line().plot_graph_mesh().
Sub-packages and modules#
Plotting routines for 3d display of data.
In Python, we define the six faces of a cuboid to draw, as well as texture cooridnates corresponding with the vertices of the cuboid.
Module providing Graph visuals for rendering graphs.
Plotting routines for 3d display of graphs.