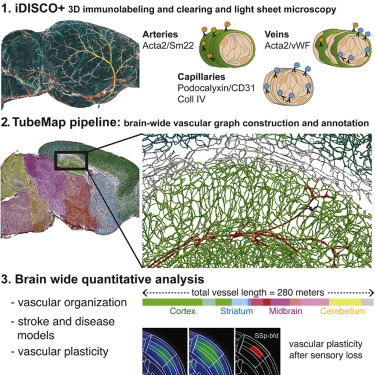
TubeMap#
This script is the main pipeline to generate annotated graphs from vasculature lightsheet data [Kirst2020].
See the TubeMap tutorial for a tutorial and usage.
This script is the main pipeline to generate annotated graphs from vasculature lightsheet data [Kirst2020].
See the TubeMap tutorial for a tutorial and usage.