Menu Batch#
Sample folders -> Process -> Comparisons -> P values -> Stats
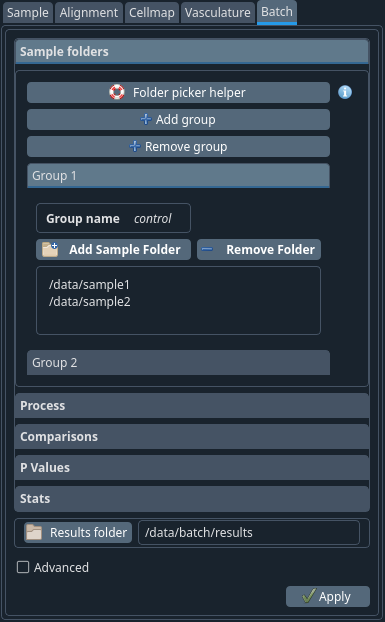
Once a set of samples have been analysed individually, you can use this tab to compare the group and perform some statistical analysis. This tab could also be used to batch process a set of data after their parameters have been defined in the config files of each individual folder.
When you click the batch tab, you will be prompted for a results folder where the combined analysis will be saved.
Warning
Before proceeding, you should ensure that all samples have unique ids within your study and that these are defined correctly. The best way to do this is to open the individual sample_params.cfg files and look for the sample_id key.
Sample folders tab#
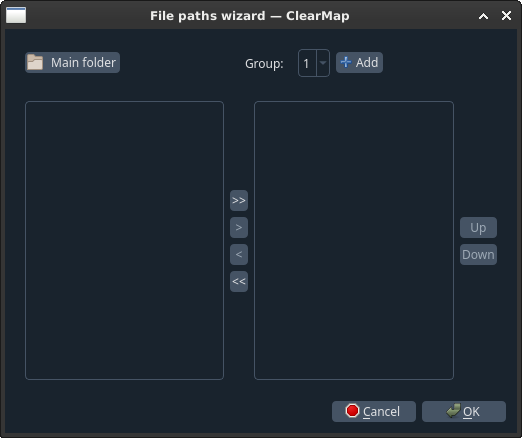
Figure 11 Folder picker helper#
When clicked, this button will open a new dialog to help you choose the samples of your study.
First, click themain folderbutton. This is the folder at the root of your sample folders.
The helper will browse this main folder recursively and find all the sub-folders that correspond to ClearMap samples (using the samples_params_cfg files).
In this window you should select the group number from the drop-down menu and move to the right column the samples for that group. Once done, move to the next group. Finally, click OK. You will be able to customise the names of the groups later in the batch tab.
+ Add group
+ Remove group
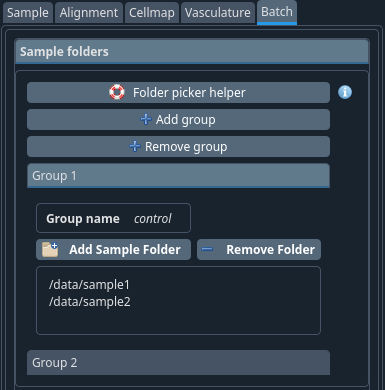
Instead of using the Folder picker help you can add your groups manually by using these options
- Group:
For each group you get the following info Group name / Add Sample Folder / Remove Folder Your files names should be displayed here

Process tab#
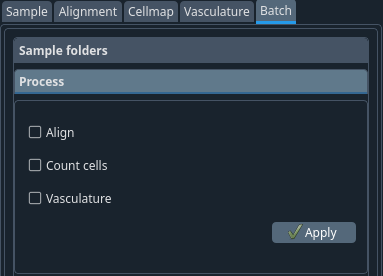
This is meant to batch process a set of data after their parameters have been defined in the config files of each individual folder. You can skip this if you already separately run ClearMap on your samples individually.

Comparisons tab#
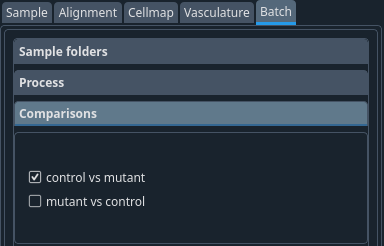
Choose the pairs of groups that you would like to compare.
Note
To make it simpler to reflect on the data, you can select the direction of the comparison (e.g. mutant to control or control to mutant)
P Values tab#
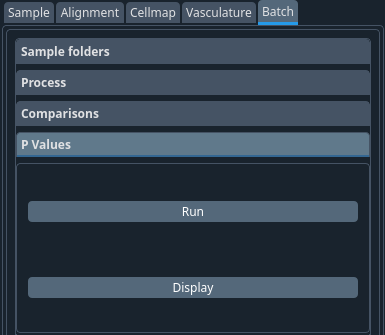
You are now greeted with the p values tab. Here you can compute (run) or display previously computed p value maps.
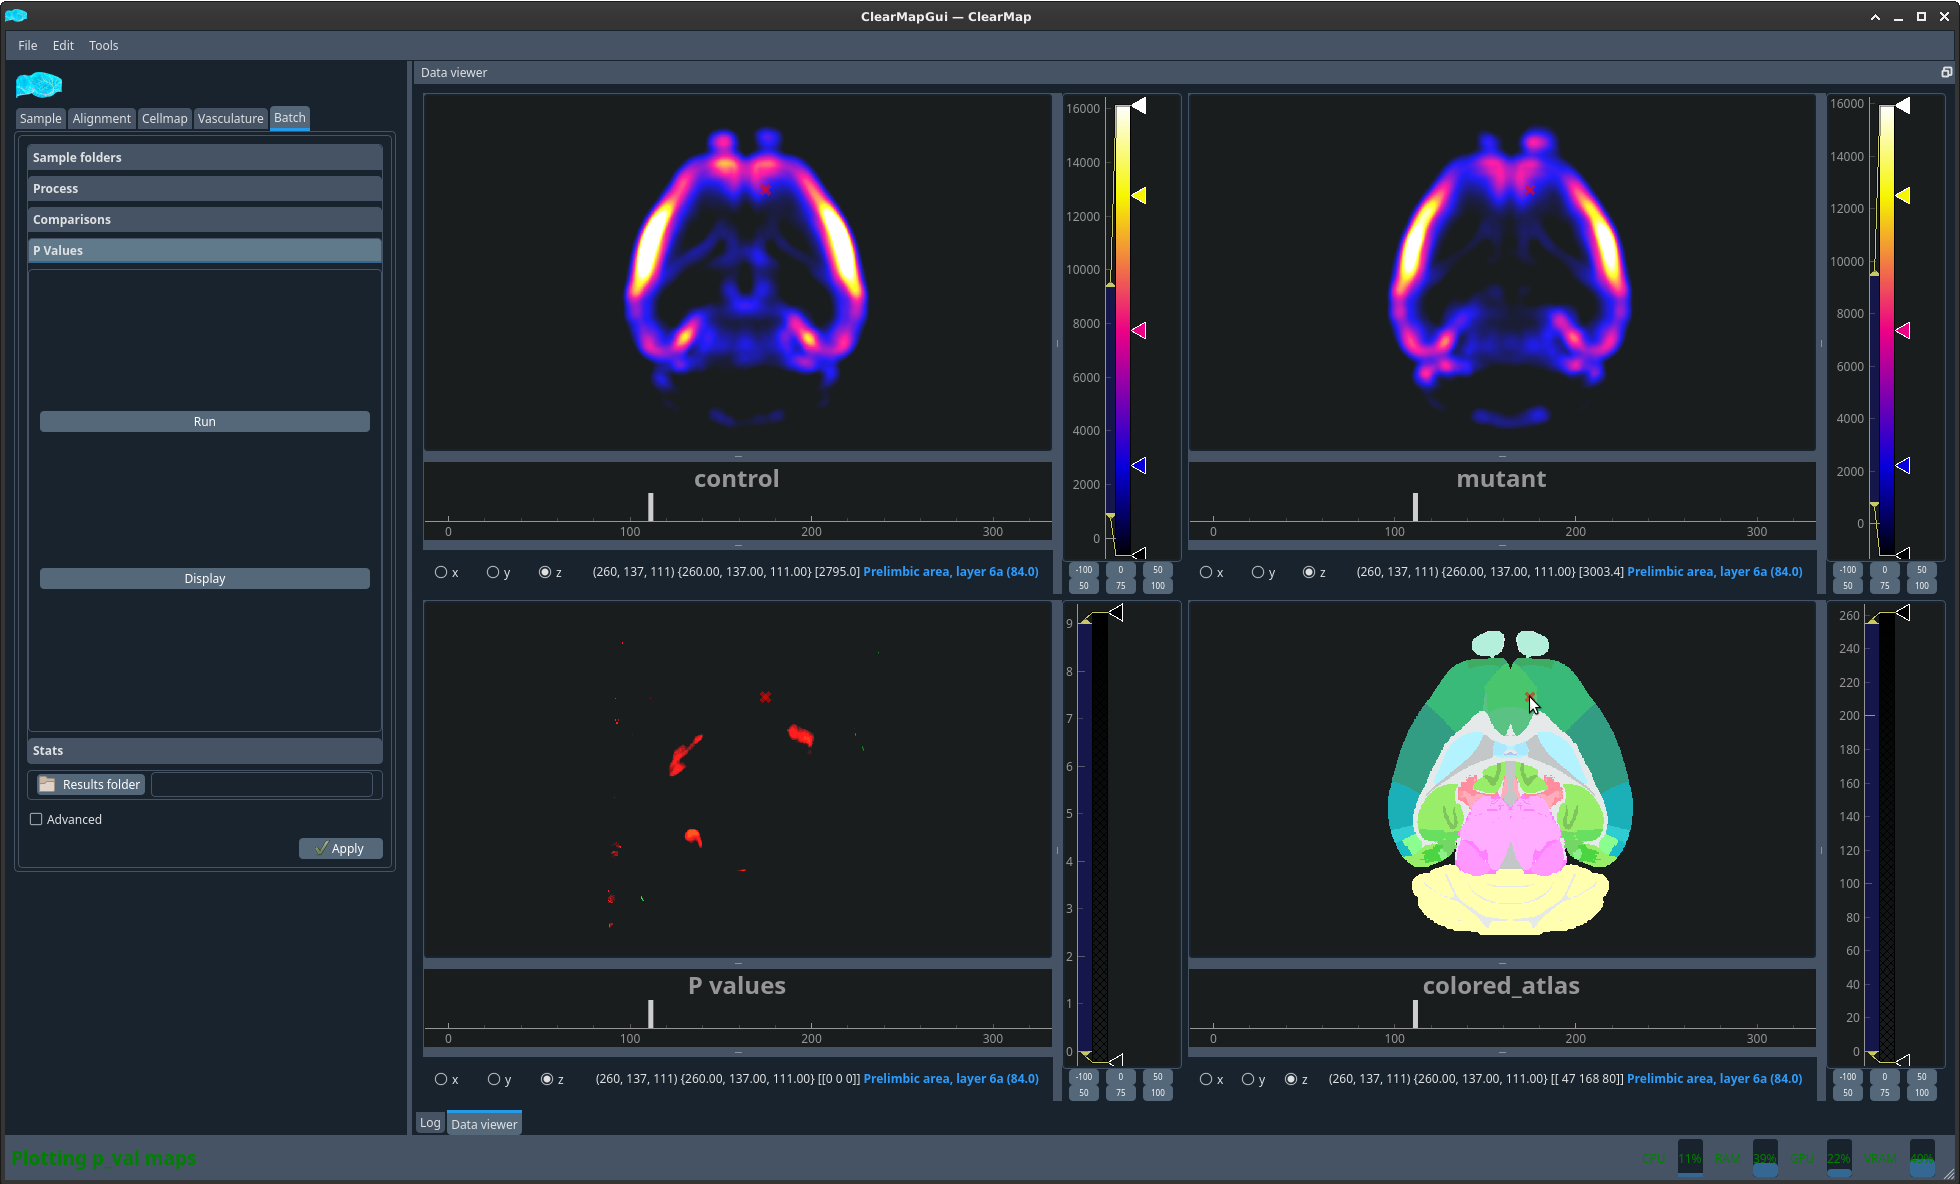
Figure 12 Example p values. Note the label of the region following the cursor.#
Attention
Known issues: If ClearMap cannot run the P-values map because the samples don’t have the same size, it is likely that the sample -> atlas space info parameters do not match. You should fix this before proceeding. A quick way to see this is to check the sample_params.cfg files of the individual folders. An other thing you may want to verify if the parameters look the same is the file size of the density_counts.tif files in the individual folders. You can also check the x/y/z dimension of these files in FIJI.
Stats tab#
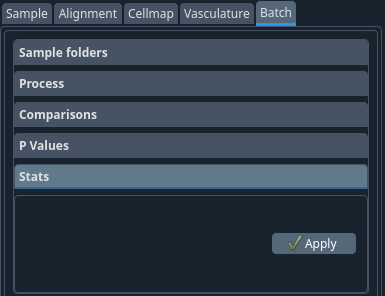
Finally, you can display (and save) stats for each sample, for each brain region.
Warning
This step will fail if some of your samples have the same ID. Please make sure this did not happen. You can double check this by looking at the sample_id variable in the sample_params.cfg file in each folder.
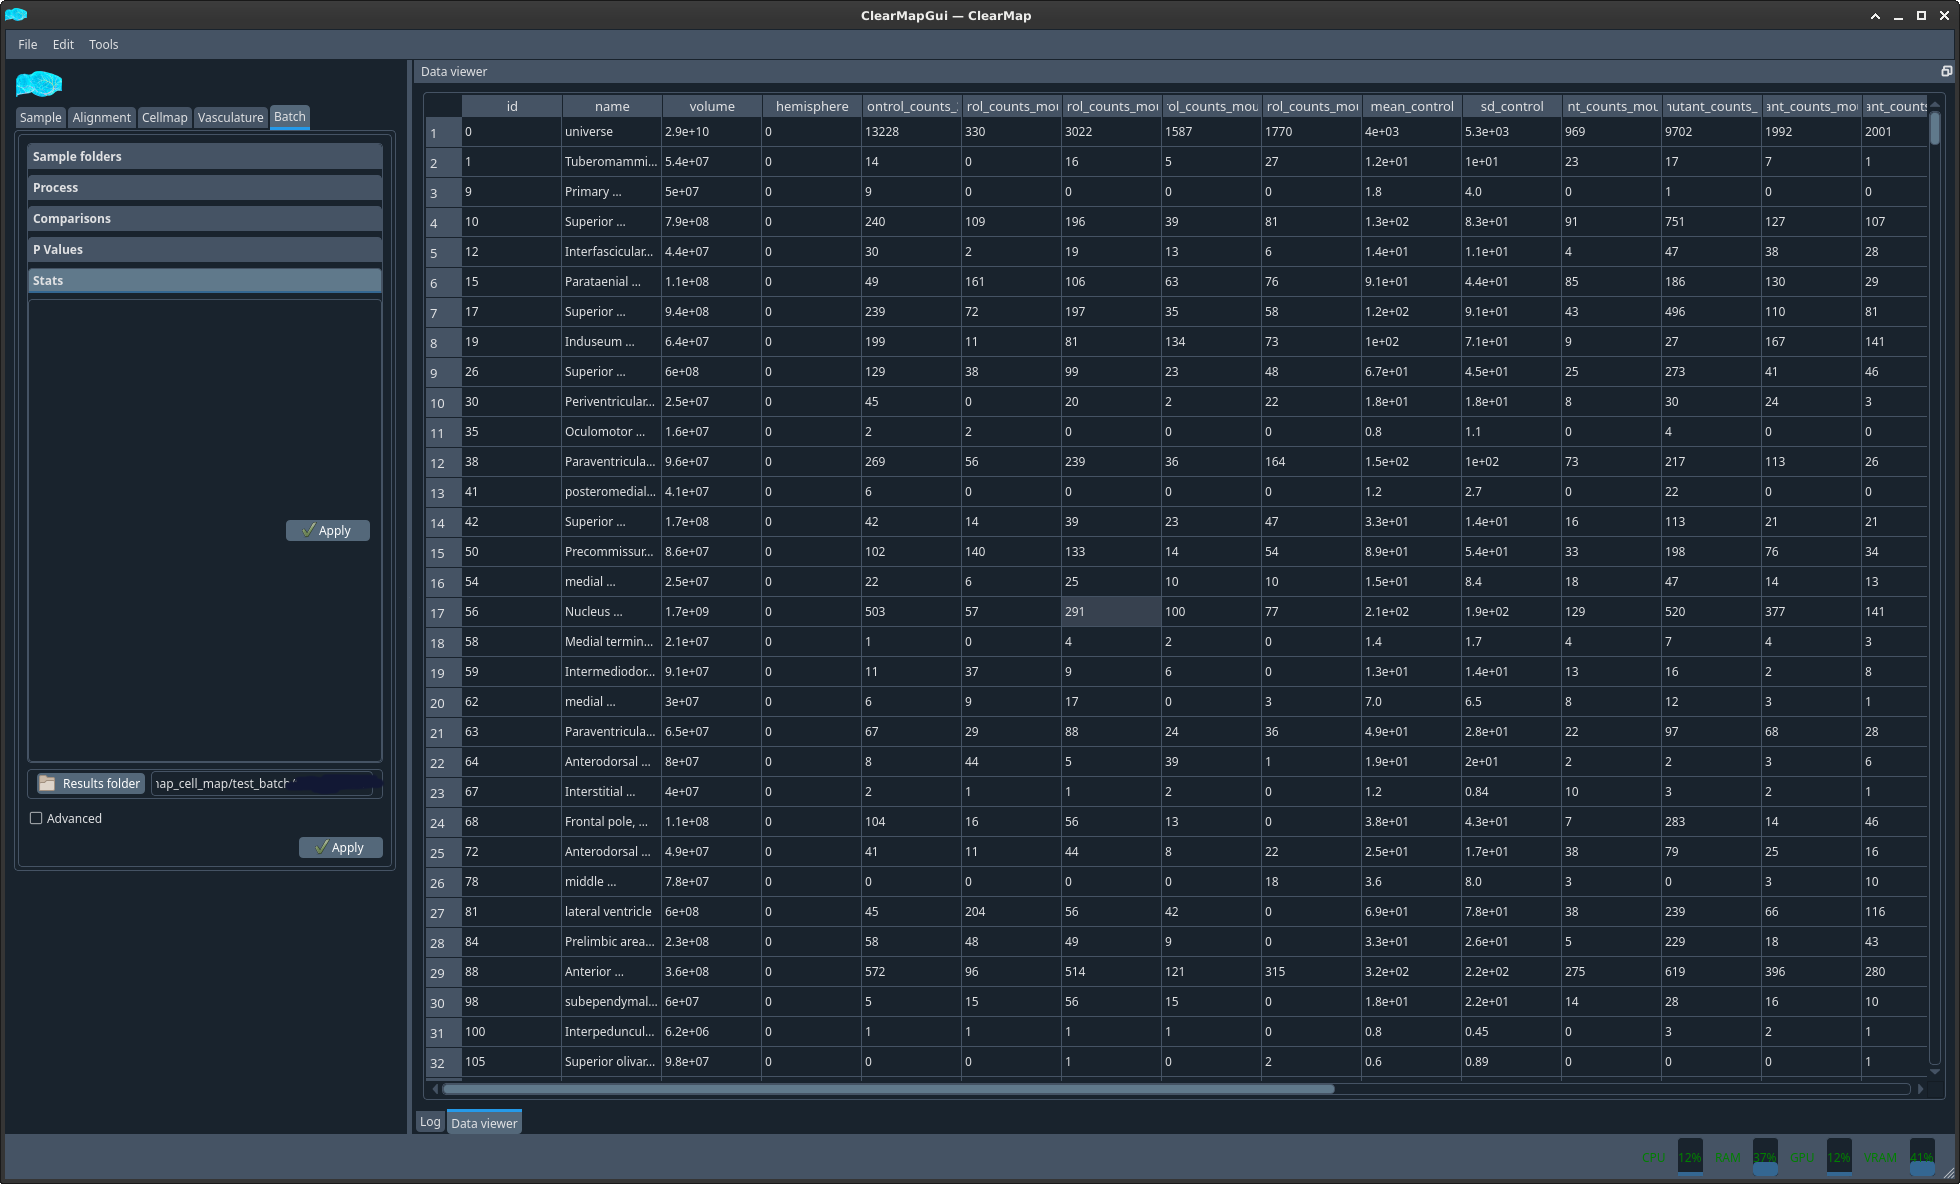
Figure 13 Example stats table#
