Menu CellMap#
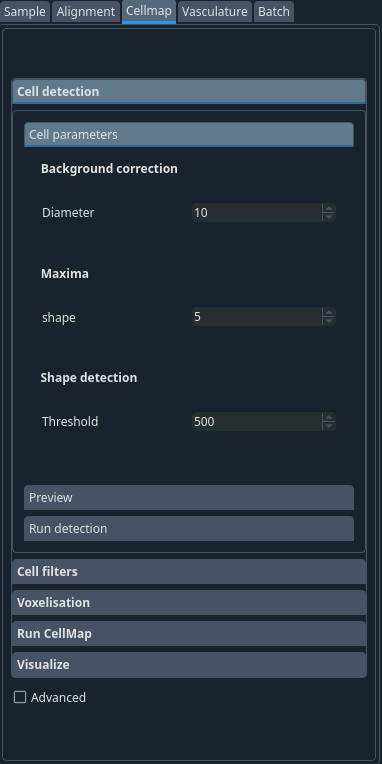
Now that the images are stitched and aligned to the atlas, you can proceed to the cell detection.
The steps are as follows:
Cell detection -> Cell filters -> Voxelisation -> Run -> CellMap -> Visualize

For more on the algorithms, please see https://christophkirst.github.io/ClearMap2Documentation/html/cellmap.html and https://doi.org/10.1016/j.cell.2016.05.007
Note
The parameters defined in this tab should be the same for all the samples! :FIXME:
Cell detection → Cell parameters tab#
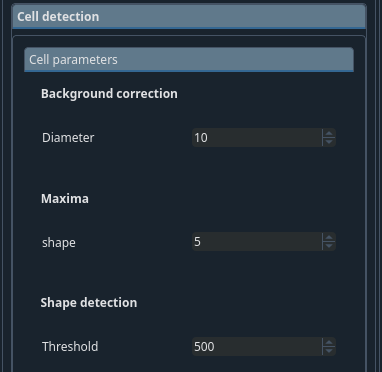
- Background correction
The diameter of the filter to estimate the background when running the background removal. This should be larger than the typical cell size.
- Shape detection
The threshold for the maxima detection. Peaks below this value are ignored. Threshold of signal you want to detect in your background subtracted image.

Cell detection → Preview tab#
Important
The cell detection is the longest running part of the pipeline. It is therefore advised to test the parameters on a subset of the brain before processing the whole sample. To do so, click load and then drag the cursors to limit a region of the brain to detect before clicking Crop to copy this region for your tests. Clicking preview will run your cell detection on this subset.
Warning
please note that you have to imagine the intersection of the 3 dimensions. You must ensure that not only there is data in the subset of each dimension but also that the intersection contains a valid region with cells in a representative manner. This regions should be a few hundred pixels across in all dimensions.
Note
Once your parameters are optimised, you will likely not need to use this tab anymore.
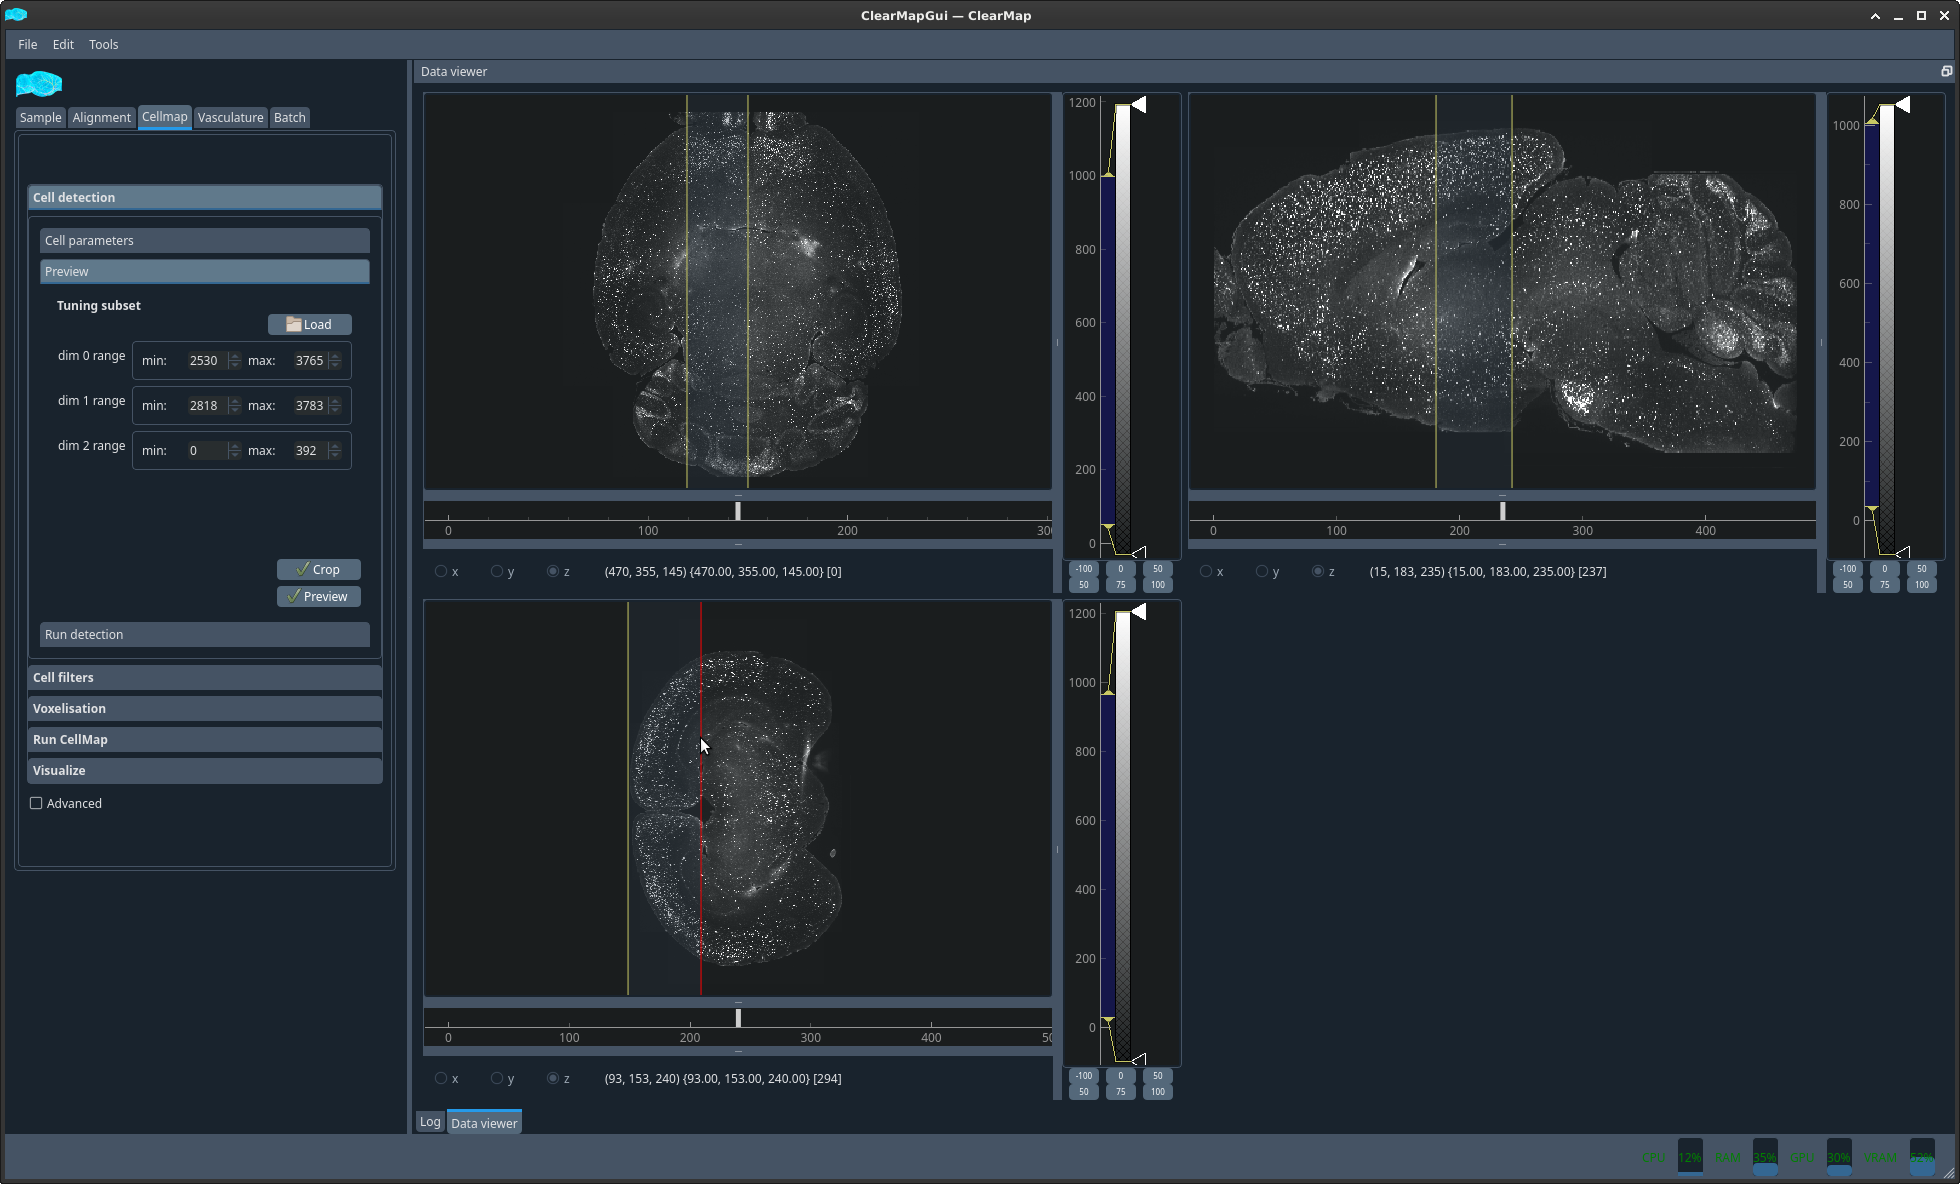
Figure 3 Subregion selection interface#
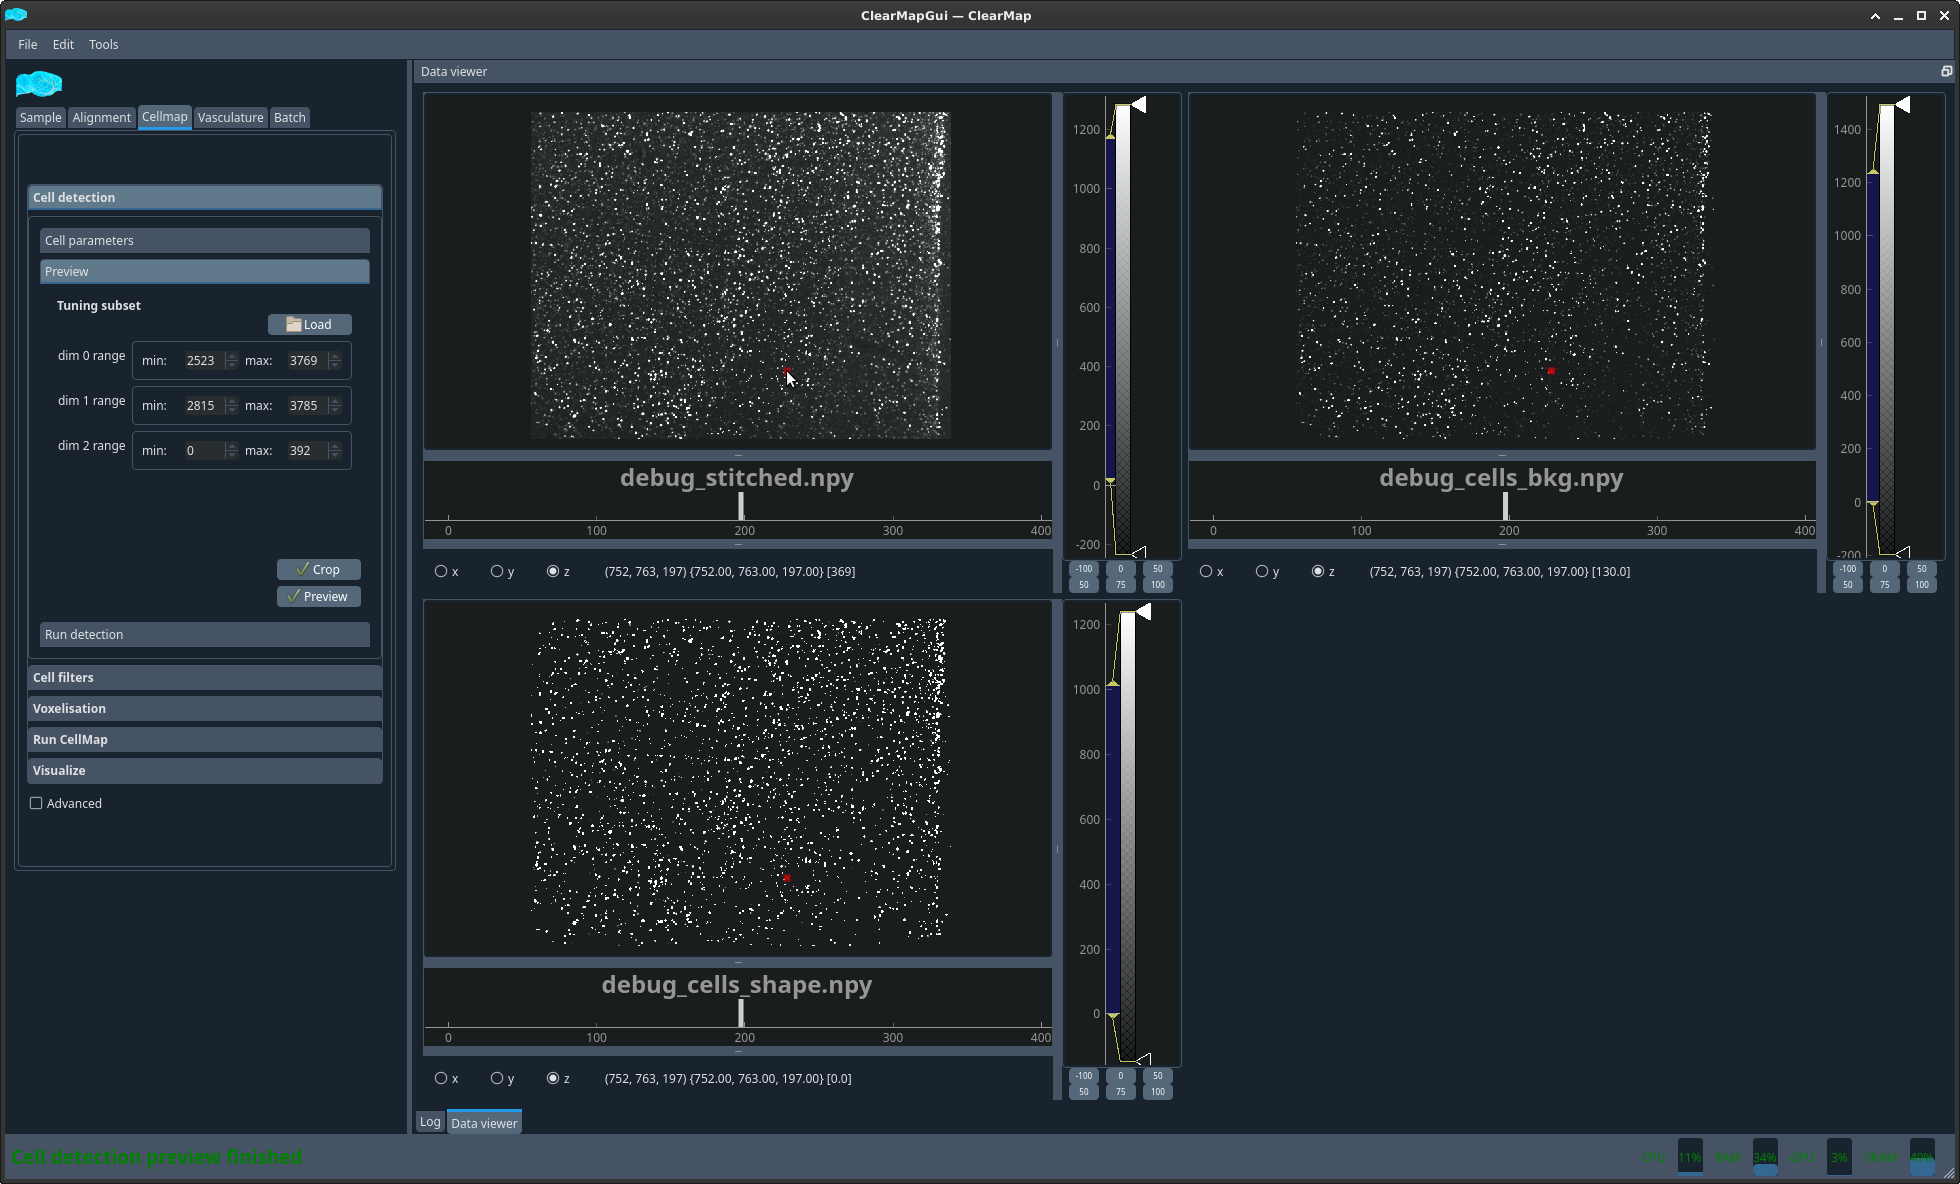
Figure 4 Example cell detection filters preview#
Cell detection → Run detection tab#
Once you are satisfied with the detection parameters, you can proceed to the detection on the whole sample using the next run detection tab
Cell filters tab#
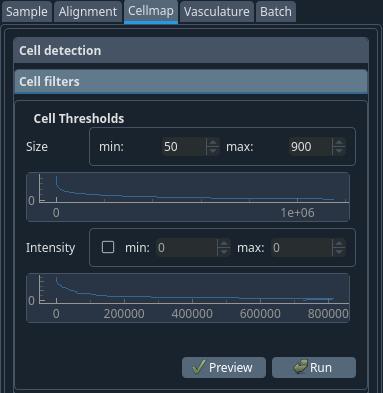
After detecting the cells, their values are inserted inside a table that you can filter.
To help you choose the following parameters, a histogram of the distribution of the parameter is displayed.
- Cell size range
Filter out cells that are not within this size range.
- Cell intensity range
Filter out cells that are not within this intensity range. Selecting this is often not required.

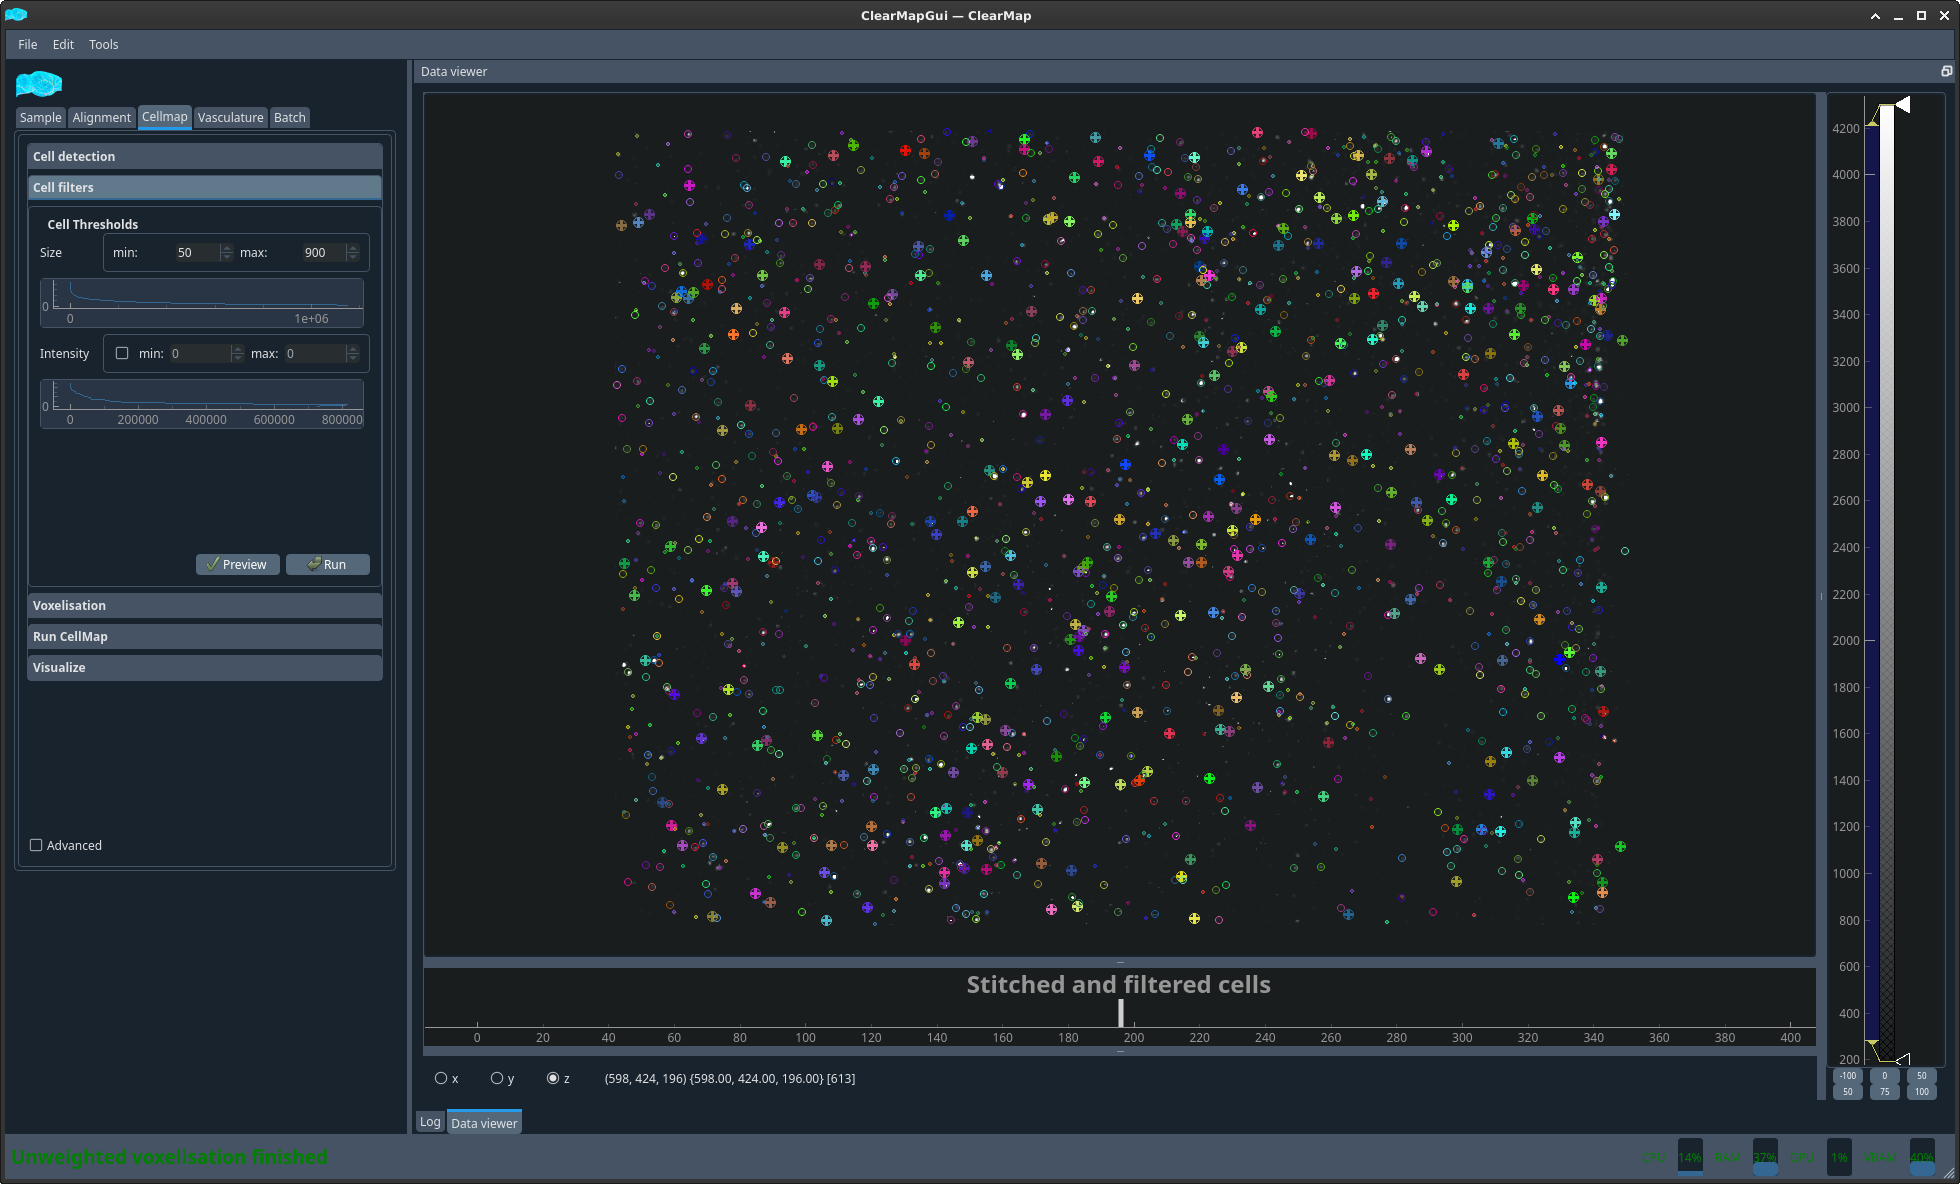
Figure 5 Example detected cells in subregion#
Voxelization tab#
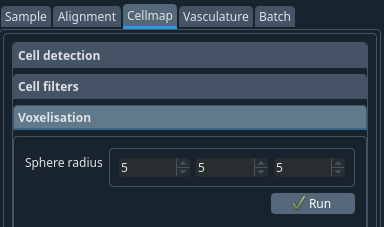
To get the probability map of the cells, ellipsoids which have the same intensity are drawn at the cell coordinates.
- Sphere radius:
The XYZ half-width of the ellipsoid used to voxelize. Values usually range from 5 to 15.
Tip
If you have very few cells, you can plot large spheres to merge more info, and do the opposite if you have many.

Run Cell Map tab#
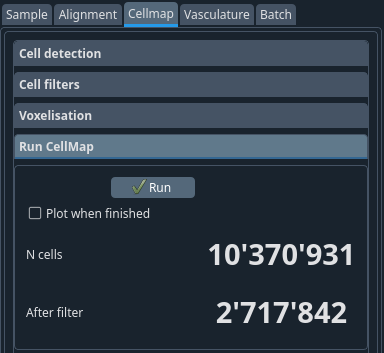
- Run
This runs the cell detection, filter and voxelization at once.
Tip
At this step, you will see the number of cells detected as well as the number that remains after the filtering step. The ratio of these two values is usually a good indication about the validity of the parameters.

Visualize tab#
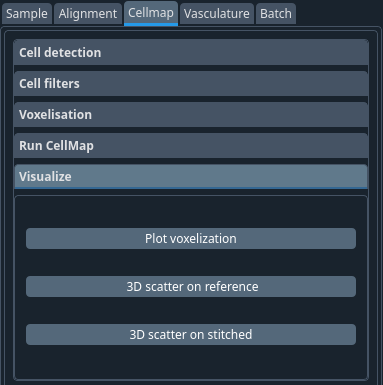
This tab provides 3 ways to visualise the results of CellMap for a single sample:

- Plot voxelization:
View the density map
- 3D scatter on reference:
Plot the coordinates of the detected cells mapped onto the reference (i.e. of the atlas) brain. The cells are coloured as per the brain regions of the Allen Atlas and the symbol indicates the brain hemisphere.
- 3D scatter on stitched:
This is the same but the coordinates are native plotted onto the stitched image.
Note
On the 3D scatter on reference you can get the name of the brain regions.
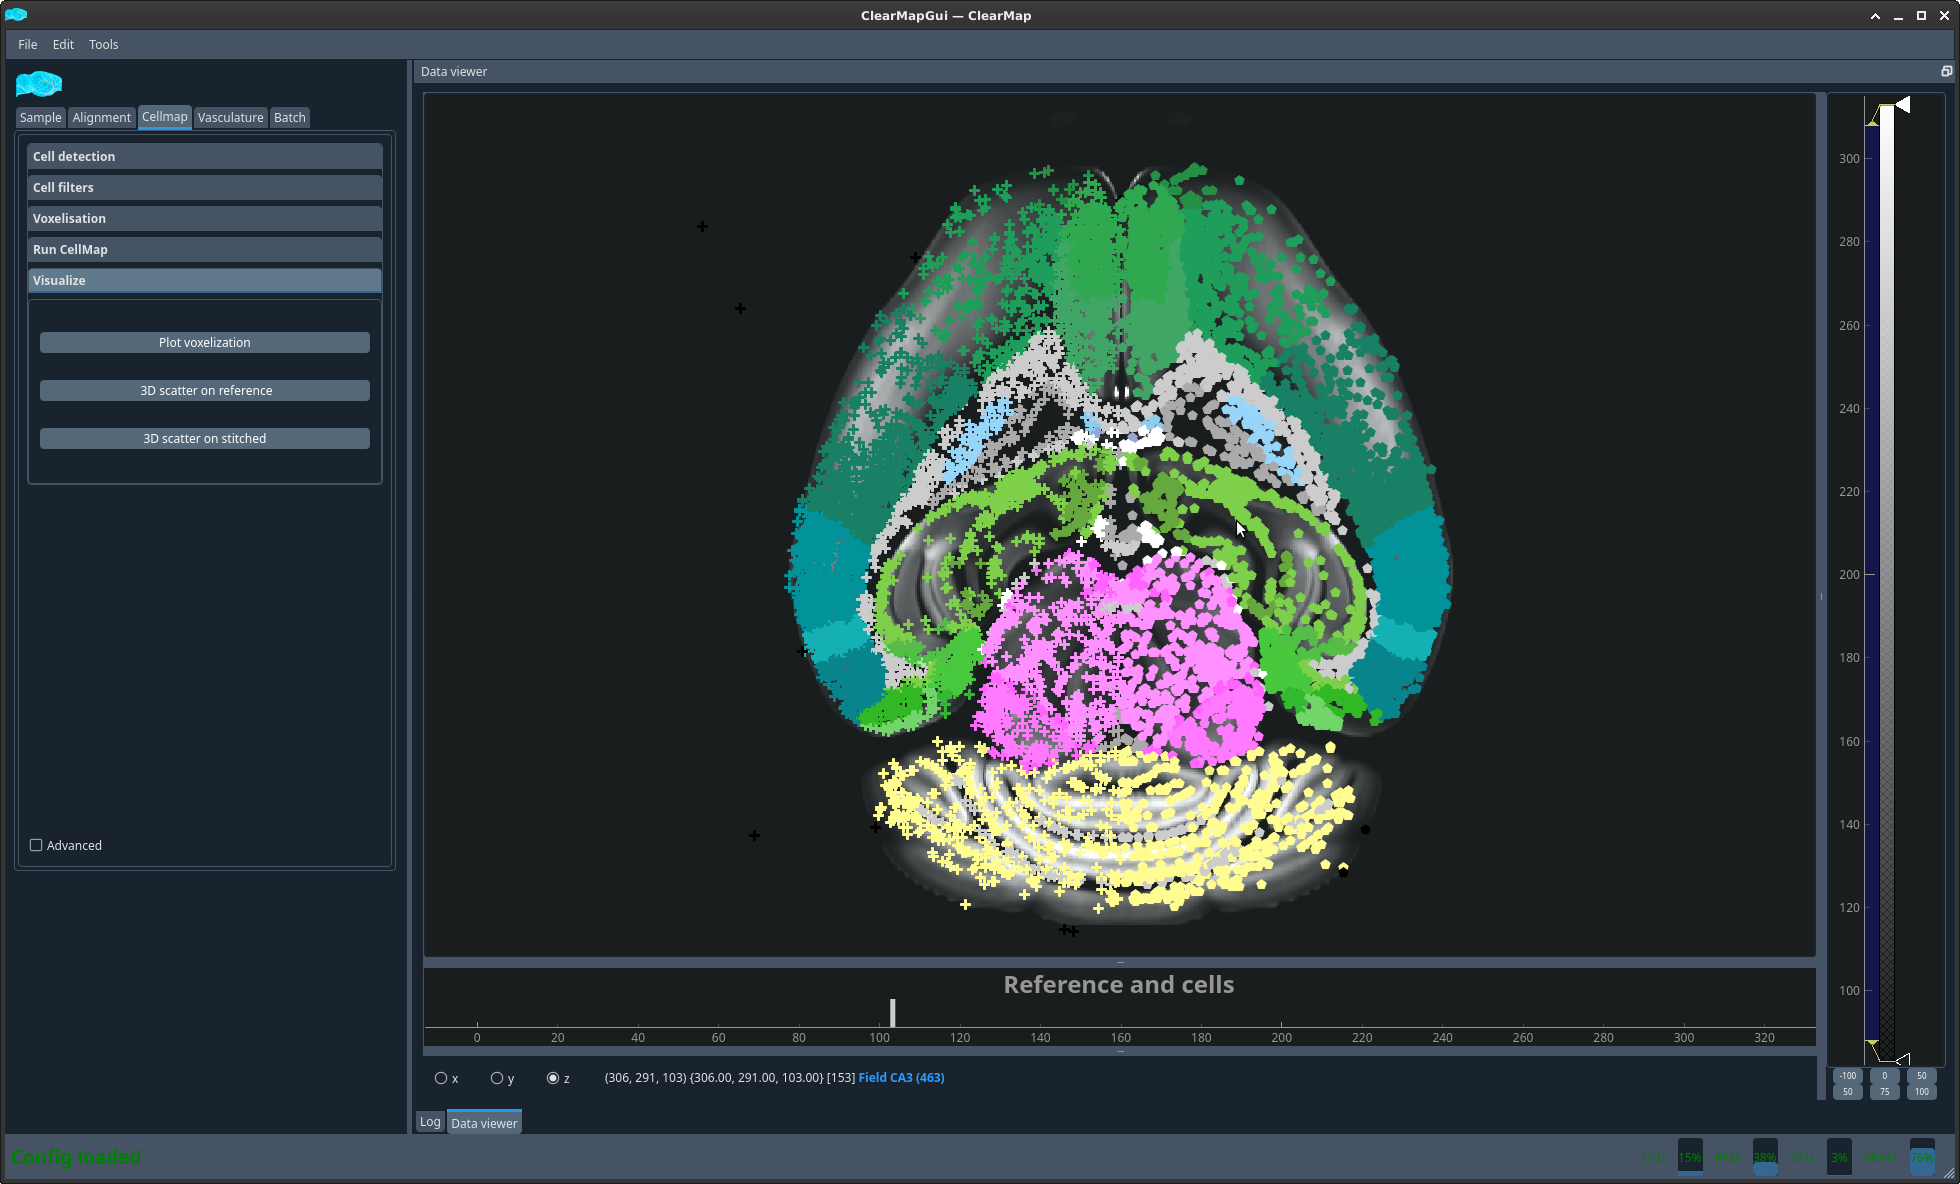
Figure 6 Cell plot on reference brain#
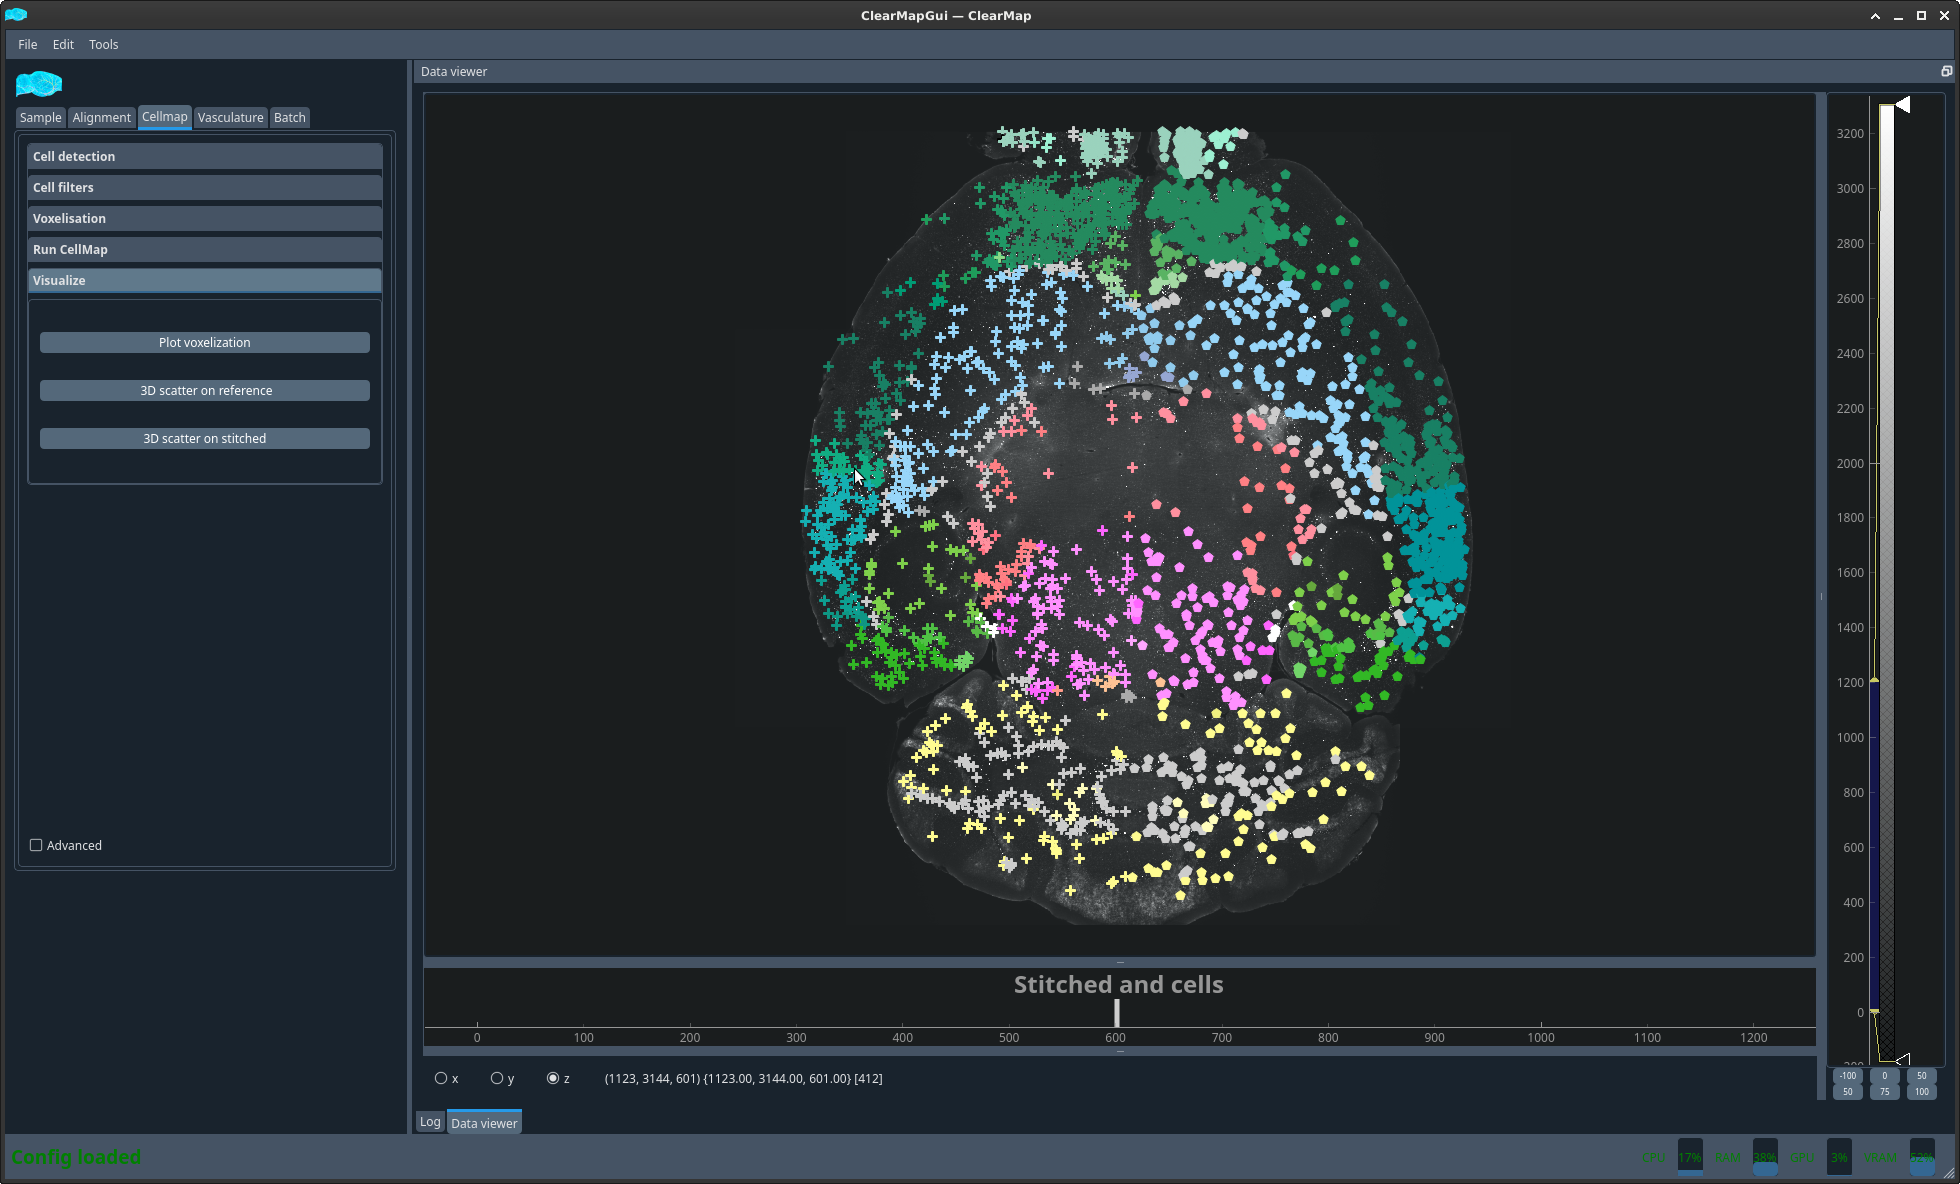
Figure 7 Cell plot on sample#
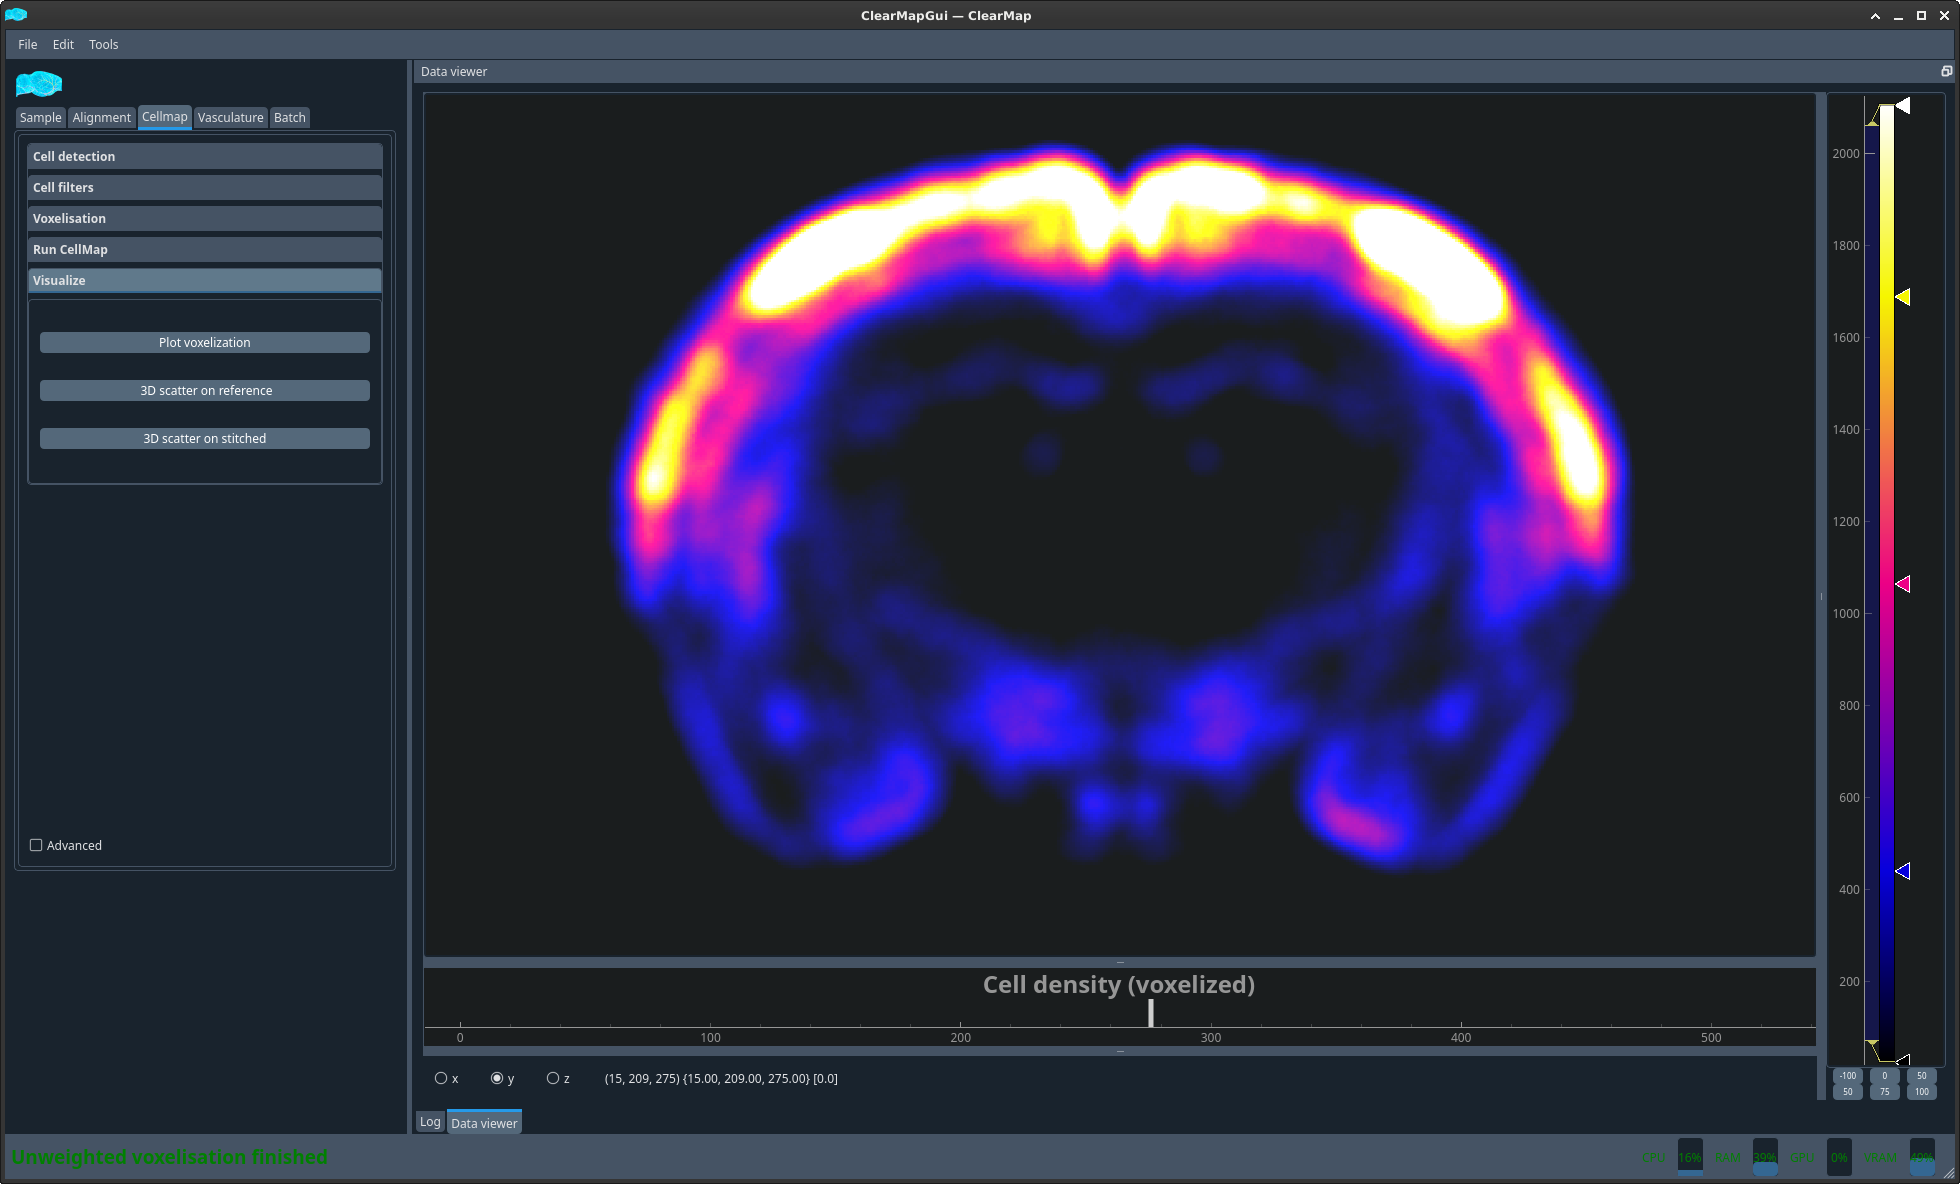
Figure 8 Density map#
