Menu Vasculature#
Vasculature -> Binarization#
This tab is meant to analyse the brain vasculature as in https://doi.org/10.1016/j.cell.2020.01.028
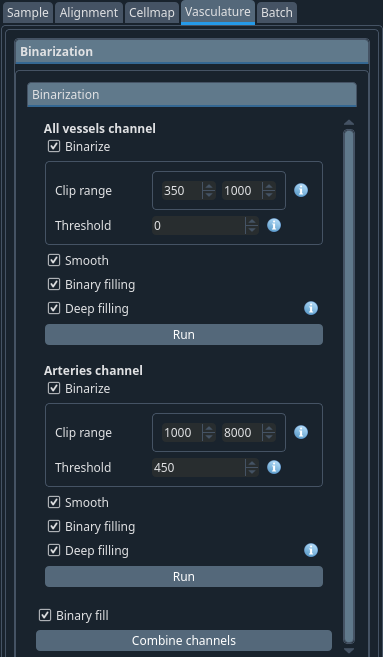
The first step consists in thresholding (“binarize”) your images. In the case of the vasculature, you are likely working with 2 channels. The first (raw) or all vessels channel and the second or arteries channel. You will need to binarize both with some postprocessing like smoothing and filling of the tubular structures before the program is able to extract the graph representation of your vascular network.
The filling step is done in 2 ways. Through a “classical” image filtering step and through a subsequent machine learning based step.
For both channels, select the steps you want to run.

- Clip range:
The valid range for the binarization. Set the minimum based on the lowest intensities you see and the maximum based on the values of large vessels at the surface. You should set to the limit to a value that still excludes the halo.
Hint
For optimal values, open the stitched image and look at the pixel intensities inside the brain (ignore the pixels outside the brain).
- Threshold:
The threshold for the pseudo deconvolution. Voxels above this threshold will be added to the binarization result in the multi-path biniarization.
Hint
Select slightly below the clip range min.
After the channels are binarized, they need to be combined into a single image. This is done with the Combine channels button.
Note
You can click on the run buttons independently and then combine or you can just select the values including the graph parameters described below and click Run all at the bottom of the controls window to run the whole vasculature pipeline at once.
Vasculature -> Display#
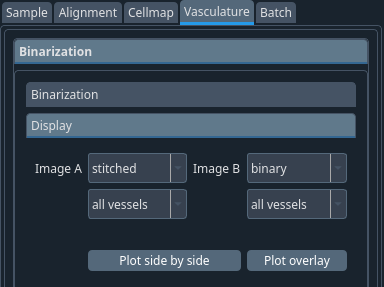
You can see how the previous steps performed using the display tab.
Select the 2 images types and channels you want to display and click on Plot side by side or Plot overlay for the corresponding display type.
Vasculature -> Graph Construction#
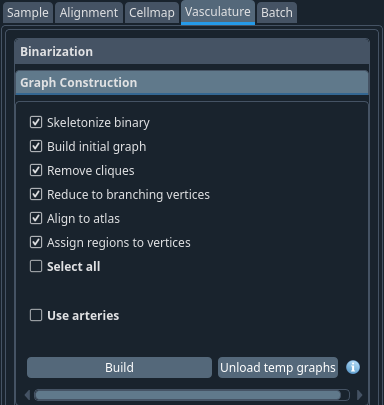
This tab will transform the binary image into a graph structure. Select the steps you want to perform (the default is all enabled and should work in most cases) and click Build.
Note
Once done, to save some RAM, you can click Unload temp graphs to remove them from RAM. The removed graphs will still be available but will need to be reloaded from the hard drive by the program upon request.
Vasculature -> Arteries and vein tracing#
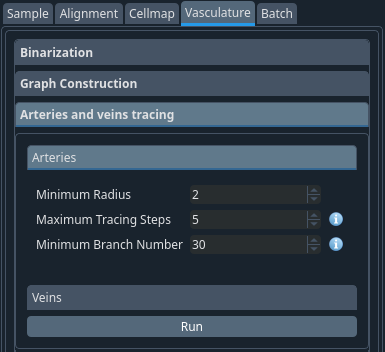
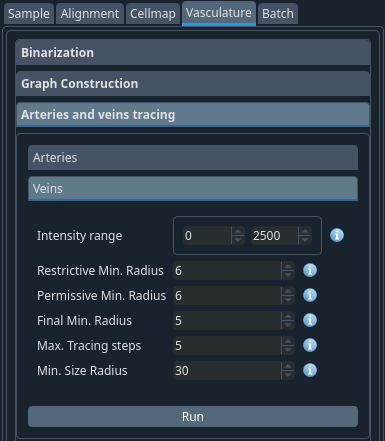
When the graph is built, the vertices are assigned an identity (vein, capillary or artery) based on the labelling intensity in the two channels. This is then refined at this step using the radius and hysteresis thresholding.
Set the minimum radius of arteries and veins
Vasculature -> Graph display#
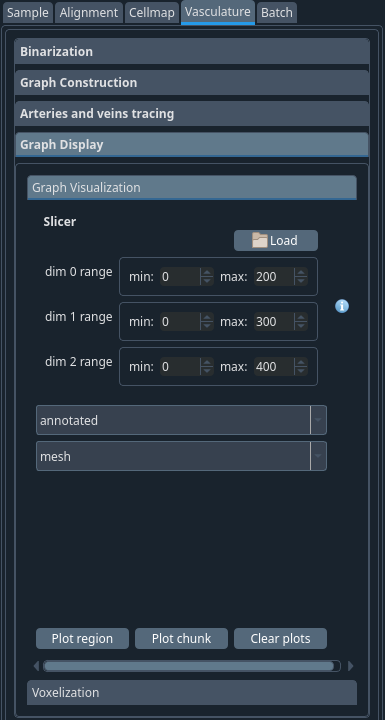
Once finished, you can visualise your graphs. Open the graph display -> graph visualization tab and select from the two options available:
- Plot region:
- First click load to open the slicer and select an appropriate
region to plot. If choosing to plot as meshes, the region should be limited (see below) because your computer cannot display too many vertices in this mode.
- Then pick the graph step to plot.
Warning
The raw graph has many vertices and you should thus choose a tiny portion
- Select your plot type
Warning
It is impossible to plot the whole brain in mesh mode. In this case, use the line mode.
Click Plot region
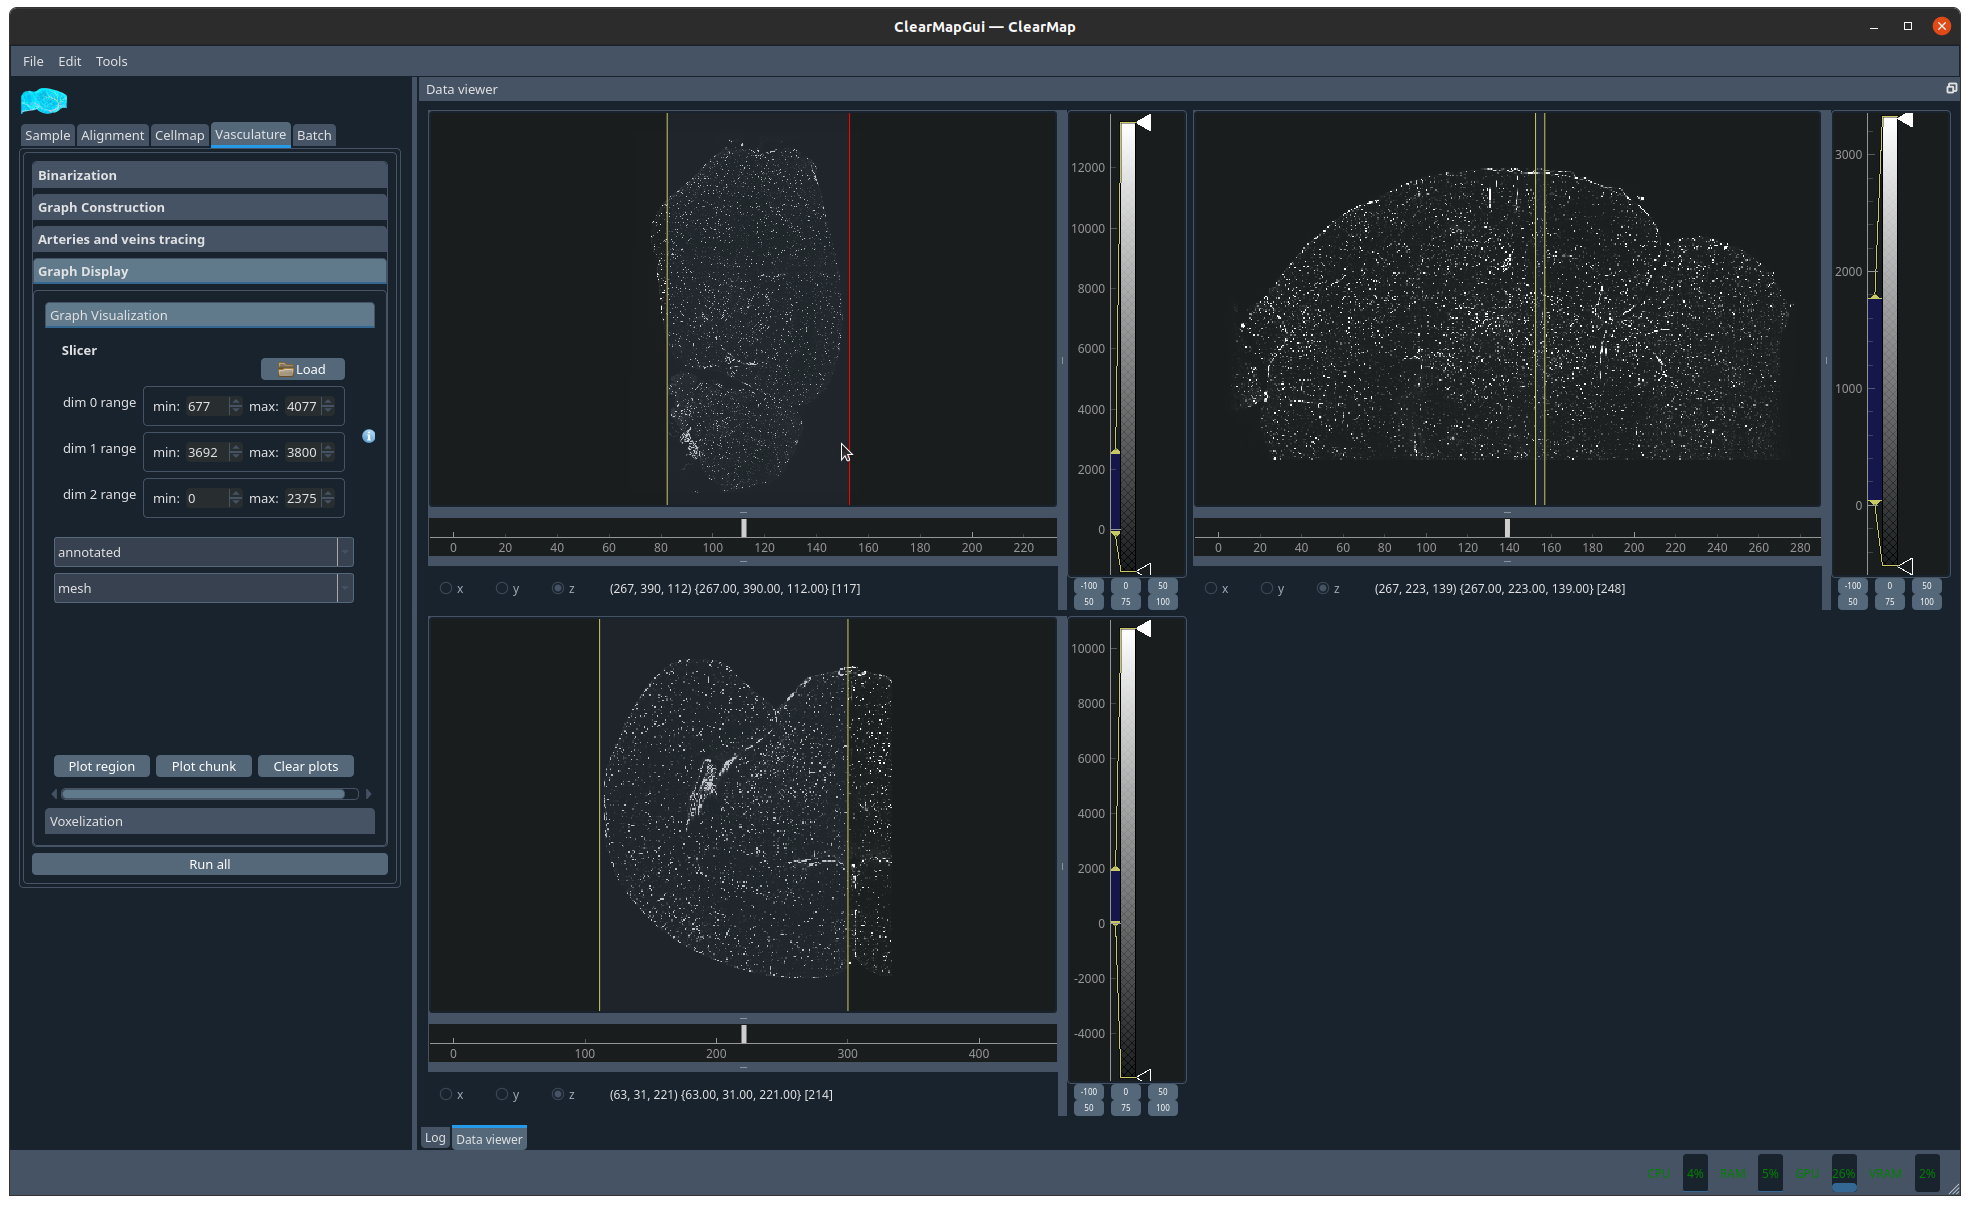
Figure 9 Picking a slice to display#
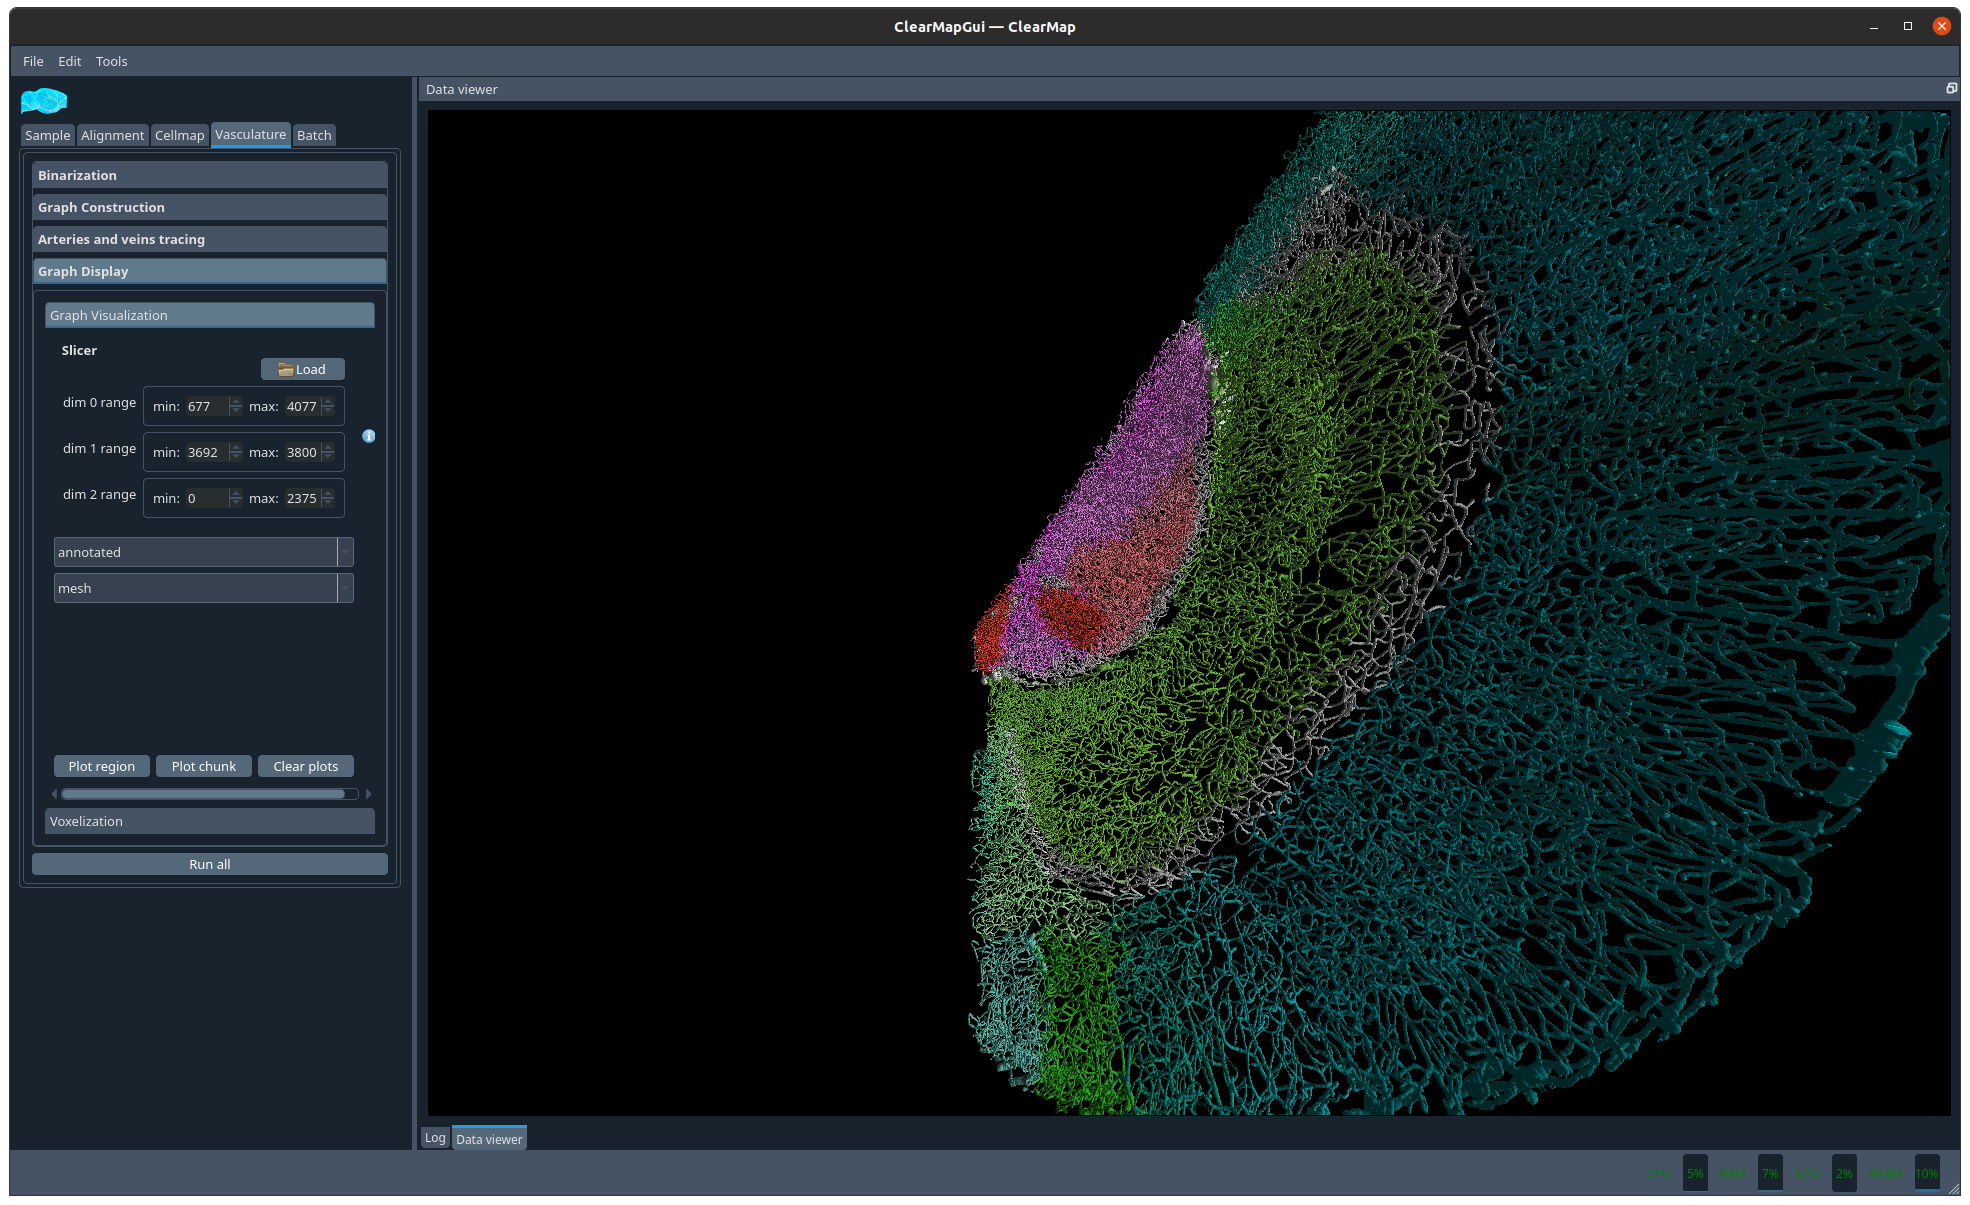
Figure 10 Example graph#
- Plot chunk
- Pick the graph step to plot.
Warning
The raw graph has many vertices and you should thus choose a tiny portion.
- Select your plot type
Warning
Use line if your region of choice is big.
- Click Plot chunk. This will open a popup window with the
tree of the brain structures which you can unfold to pick a region of your choice.
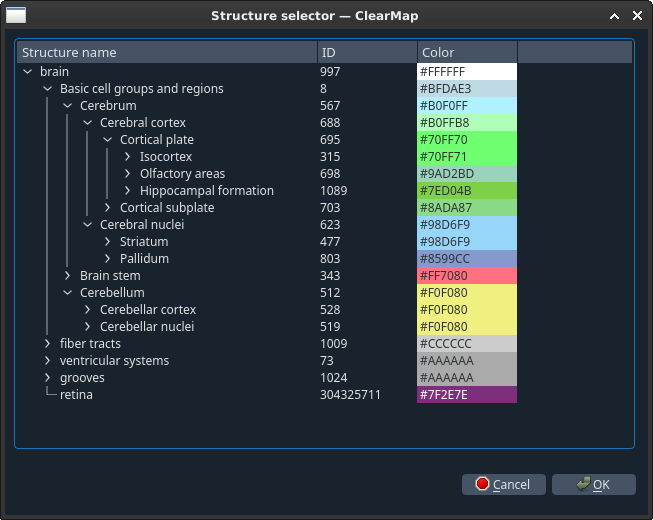
Click OK and wait for your graph to appear.